Module 01: UI overview and OpenShift console plugins
This module introduces the Red Hat Advanced Cluster Security 5.0 console. Presenters walk through the PatternFly-updated dashboard, navigation, global search, and the OpenShift console security plugin to establish the full scope of the platform before diving into individual use cases.
Part 1: Dashboard and top bar
Know
Context: Securing containerized workloads at scale requires visibility across the entire environment from a single control plane.
Business challenge:
-
Security teams managing containerized applications face fragmented tooling: separate scanners, policy engines, and runtime monitors
-
Without a unified view, understanding where risk lives across clusters, namespaces, and deployments requires multiple context switches
-
Compliance audits and incident response are slowed by the need to correlate data from disconnected systems
What RHACS provides:
-
A single security control plane spanning the full application lifecycle: build, deploy, and runtime
-
Centralized visibility into vulnerabilities, policy violations, network flows, and runtime activity across all connected clusters
-
Actionable data organized by risk priority, not raw alert volume
Key message for this audience:
For platform teams, RHACS integrates with OpenShift and the OpenShift console natively. No agents to manage, no separate infrastructure to run. For security teams, it surfaces Kubernetes-native risk signals that traditional tools miss entirely.
Show
What I say:
"Let me start by orienting you to the RHACS 5.0 console. This is your security operations view for everything running in OpenShift. I’ll show you how it’s organized before we go deeper into each use case."
What I do:
-
Open the RHACS console.
Access it from the RHACS Console tab in the right panel, or navigate directly to {acs_route}[window=blank].
-
Log in using:
Username:
{acs_portal_username}
Password:
{acs_portal_password}
Choose the standard username and password option, not the monitoring login path. -
Navigate to Dashboard from the left side menu.
-
Walk through the dashboard sections:
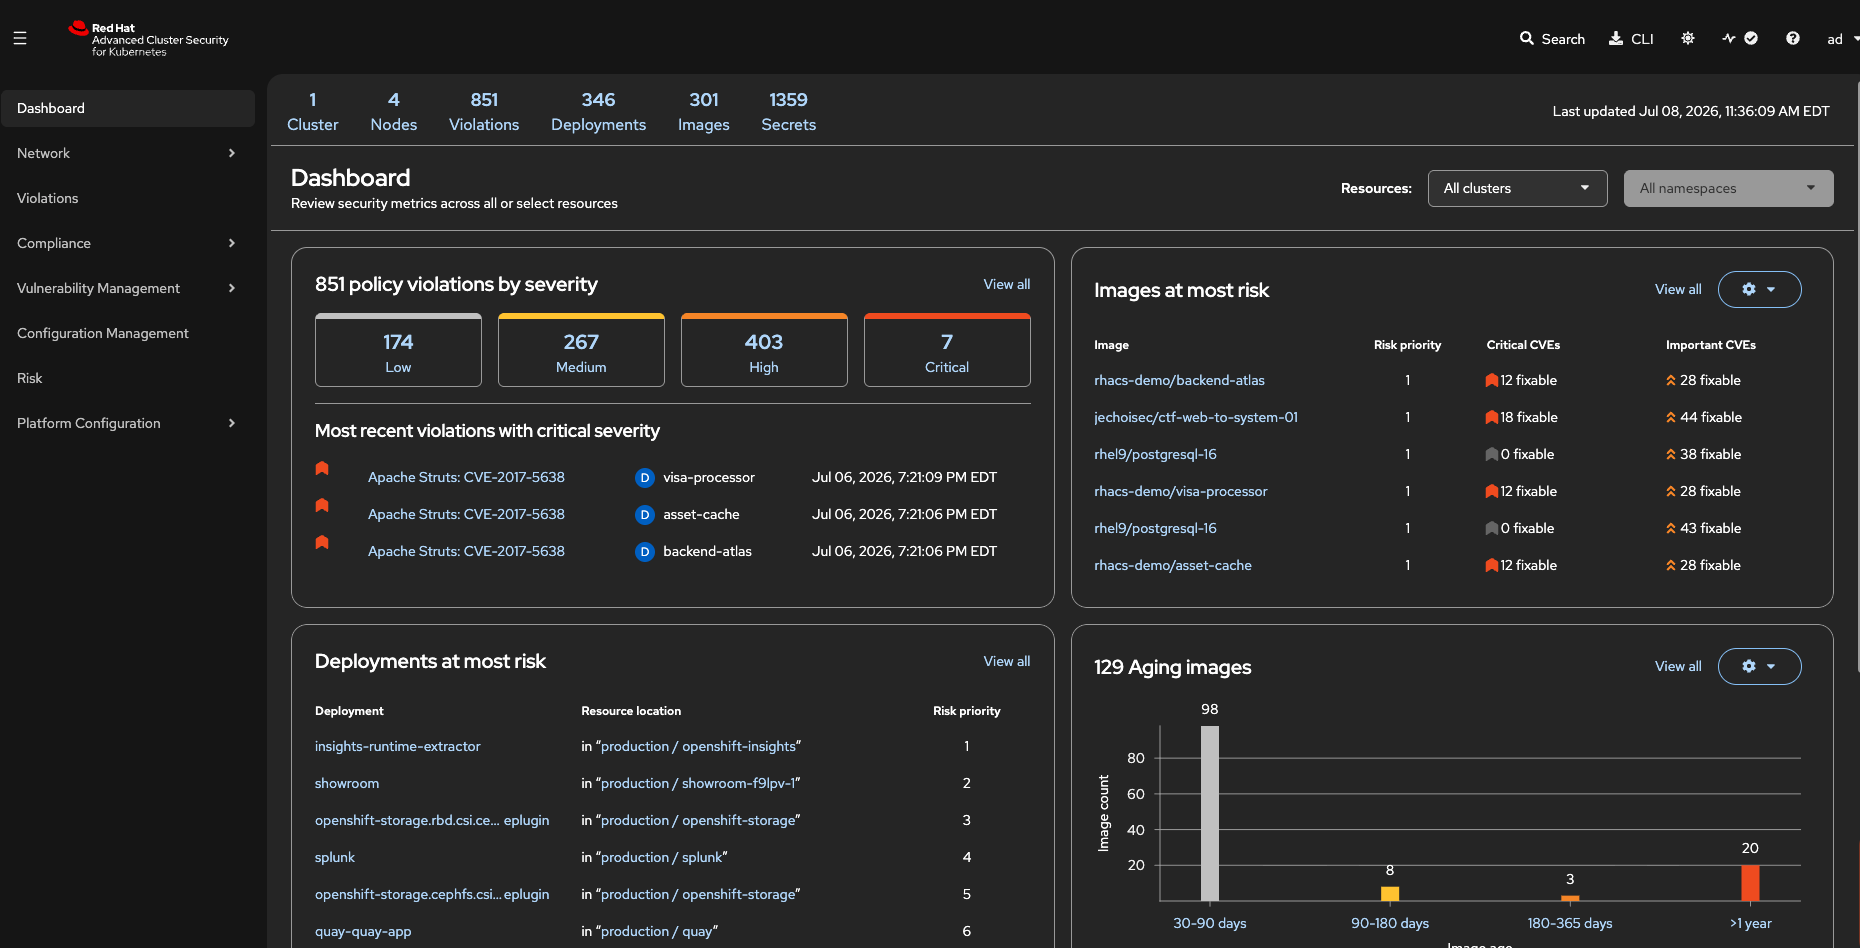
"The dashboard is the security overview for the platform — risk categories, violation counts, and compliance posture all in one place. Every element is clickable for deeper detail, and the categories are customizable. In 5.0, policy categories on the dashboard are deduplicated so you see a single, consistent list."
-
Hover over the top bar and highlight:
"At the top, you can see we have one OpenShift cluster with 4 nodes connected. RHACS supports any number of clusters in a single UI, which is important for teams managing multiple environments — staging, production, edge."
-
Click the top bar summary counts to show:
-
Violations count
-
Deployments count
-
Images and Secrets summary
-
What they should notice:
-
The PatternFly-updated UI presents the same security workflows with a cleaner, more consistent layout
-
The dashboard aggregates risk signals without requiring manual correlation
-
Cluster and node counts are visible at a glance
-
Policy categories on the dashboard are unified without duplicate entries
|
Presenter tip: If asked about multi-cluster support, confirm that RHACS connects to any number of OpenShift or Kubernetes clusters and presents a unified view. |
Part 2: Navigation and global search
Know
Context: The breadth of what RHACS monitors often surprises teams new to the platform. This section establishes the full scope before the detailed use case demos.
What RHACS tracks across your environment:
-
Vulnerabilities in container images, running deployments, cluster nodes, and virtual machines running on OpenShift
-
Deployment configuration risk: privileged containers, exposed ports, missing resource limits
-
Network traffic flows between deployments: both observed baseline and anomalous connections
-
Runtime process activity inside pods: what is running and what deviates from the established baseline
-
Policy violations across build, deploy, and runtime lifecycle stages
-
Compliance posture against standards including PCI-DSS, HIPAA, CIS Benchmarks, and NIST SP 800-190
Why global search matters for security and platform teams:
Security incidents and audits often start with a question: "Are we running this image anywhere?" or "Which deployments are affected by this CVE?" RHACS answers those questions instantly across the entire environment, without requiring manual inventory, scripting, or cluster access.
Show
What I say:
"Before we go into the individual use cases, I want to show you the left-hand navigation and the global search. This gives you a sense of the full scope of what RHACS monitors, which will make each section more meaningful."
What I do:
-
In the search bar enter 'CVE' and 'CVE-2018-1121' and press Enter:
"The search bar helps you identify workloads that are affected by a particular CVE. It’s a powerful way to quickly answer questions about your environment. You can click directly on the results to see more details. For example, we can view the risks associated with the CVE-2018-1121 in specific deployments."
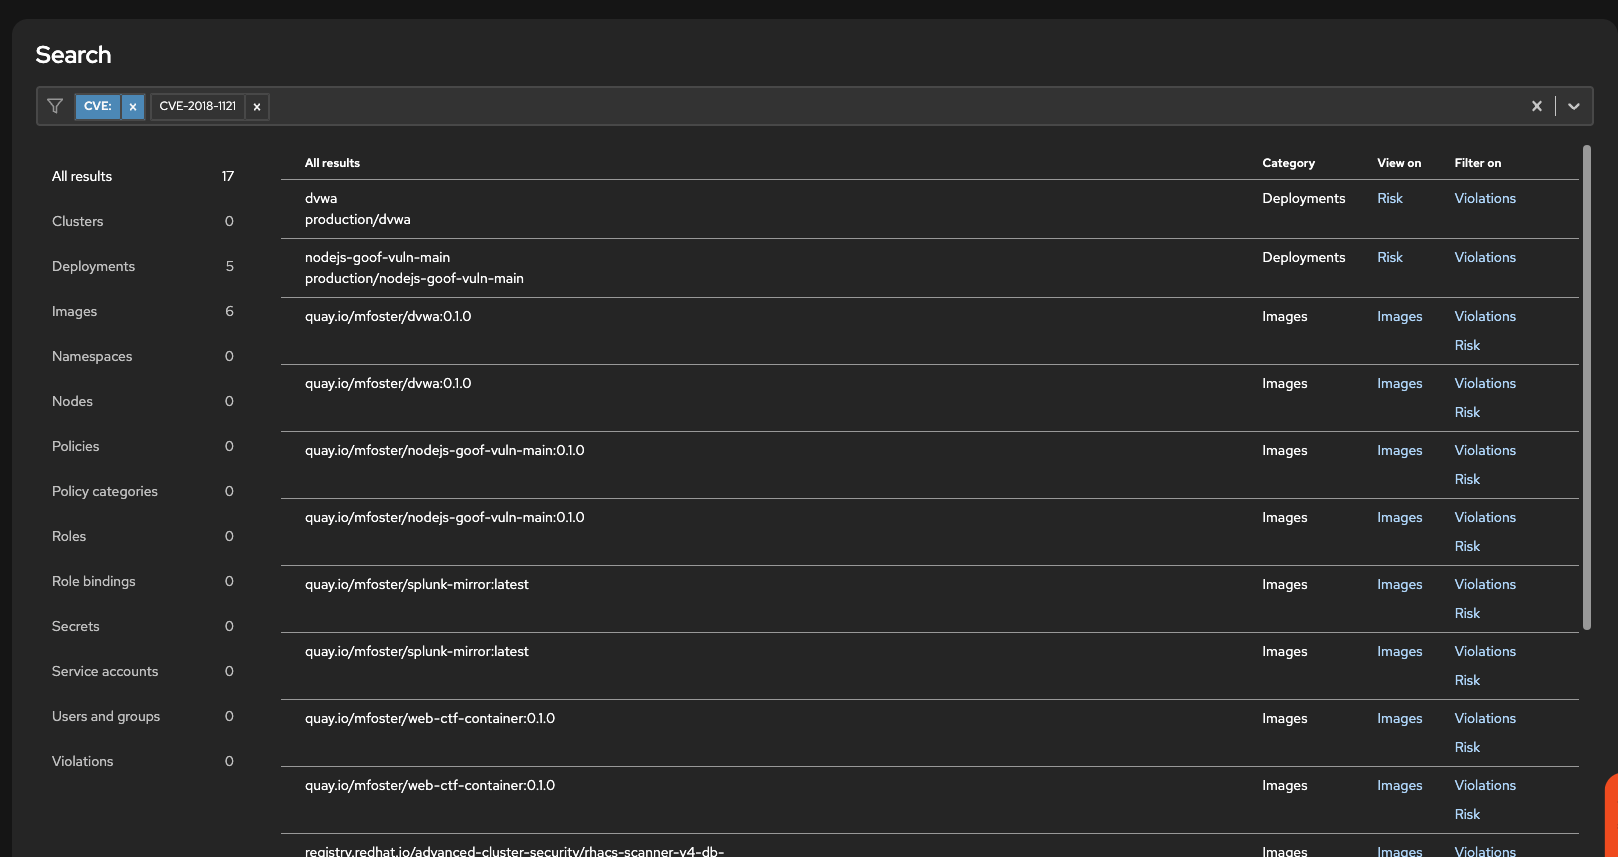 Figure 2. Global search filtering by CVE
-
Clear the search and type 'CVE' and
CVE-2021-44228:"This is popular for search bar to answer questions like 'Are we impacted by log4shell?' is a one-line query across the entire environment. You get affected images, deployments, and namespaces in a single result."
-
Close the search.
What they should notice:
-
Search spans all tracked data: CVEs, images, deployments, runtime process activity
-
Results are cross-referenced so a CVE query returns affected deployments, not just a finding list
-
No query language to learn; search uses structured keys with auto-complete
|
Presenter tip: For security operations teams, emphasize that global search replaces the need for kubectl commands or node-level access during incident investigations. For platform teams, emphasize that this data is collected automatically by the RHACS sensor with no manual instrumentation required. |
|
Transition: From here, we go into the individual security workflows. We will start with Vulnerability Management, which is the first area most teams want to explore. First, a quick look at how 5.0 brings vulnerability context into the OpenShift console itself. |
Part 3: OpenShift console security plugin
Know
Context: Security teams want findings where developers and platform engineers already work. Switching between the OpenShift console and a separate security portal slows triage and remediation.
What RHACS 5.0 adds:
-
A dynamic plugin for the OpenShift web console on secured clusters, delivered with the RHACS Operator
-
A Security navigation entry with a Vulnerabilities view scoped to the selected project or namespace
-
A Security tab on project, namespace, deployment, and daemonset detail pages with workload vulnerability context
-
The same vulnerability data as the RHACS portal, without context switching for namespace-scoped triage
| This demo environment enables the console plugin during installation. On a fresh 5.0 install, the plugin is enabled by default. After upgrading from an earlier RHACS version, you must enable the Console plugin when installing or updating the RHACS Operator. |
For more information, see the Accessing vulnerability information in the OpenShift web console documentation.
Show
What I say:
"RHACS 5.0 also meets your teams in the OpenShift console. Operators and developers can see vulnerability context on the resources they already manage, without opening the RHACS portal."
What I do:
-
Go to the webpage URL: {openshift_cluster_console_url}/acs/security/vulnerabilities?entityTab=CVE
-
Select the project apache-struts in the top left dropdown
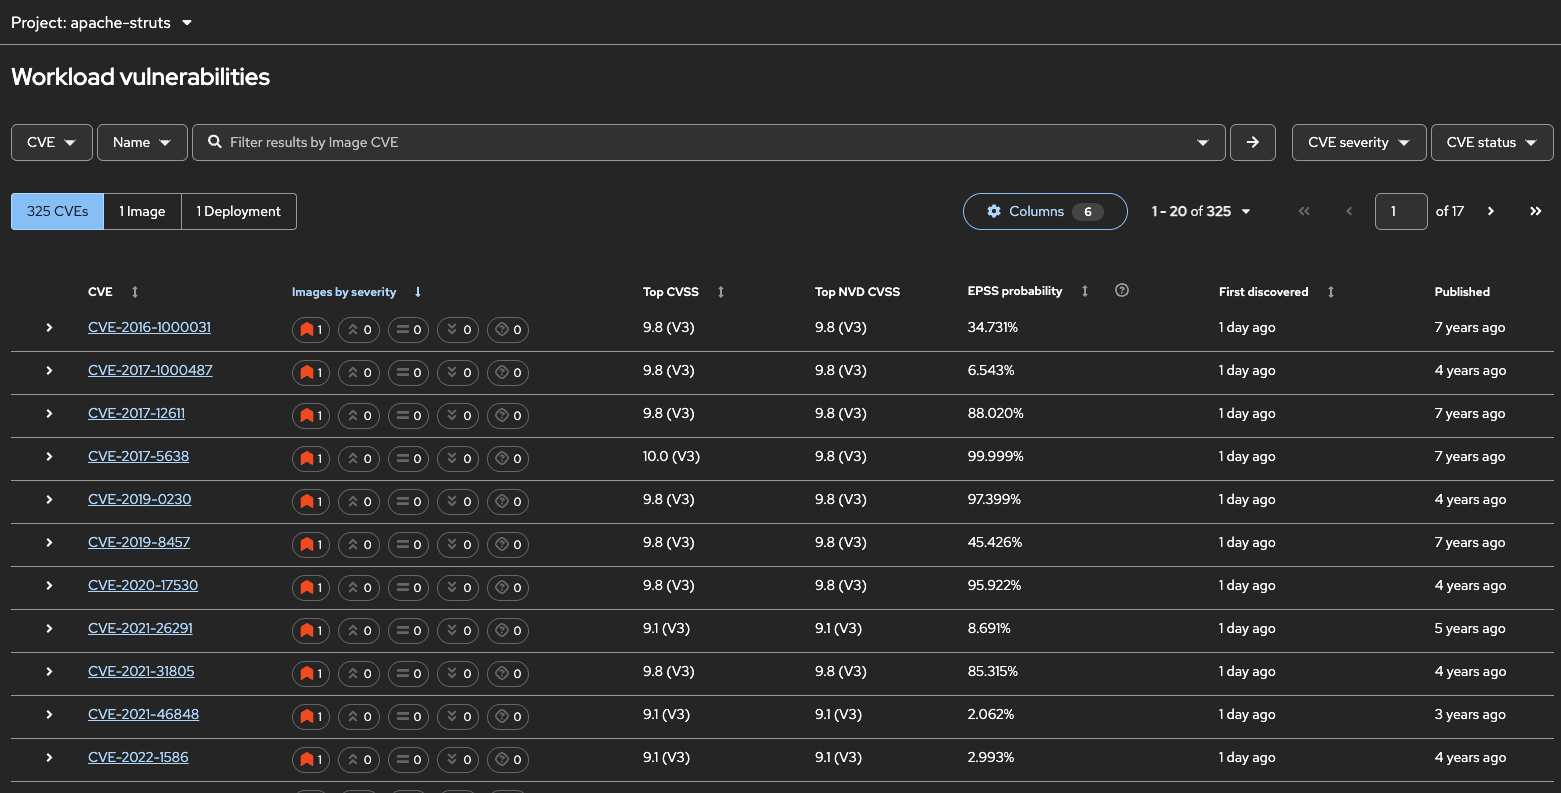 Figure 3. OpenShift console Security Vulnerabilities view
"This view is scoped to the project you selected. You can pivot by CVEs, images, or deployments — the same workload-centric model as the RHACS portal, but inside OpenShift. You can see the vulnerabilities for the apache-struts project."
-
Click "Deployment" → "apache-struts" and open the Deployment in that project and click the Security tab.
"The Security tab on resource detail pages shows vulnerability information for that specific workload. That is the zero-context-switching story for 5.0: triage where you deploy, enforce where you operate."
-
Return to the RHACS console tab to continue the demo modules.
What they should notice:
-
Vulnerability data is available in both the RHACS portal and the OpenShift console
-
Project-scoped views respect OpenShift RBAC; users only see data for namespaces they can access
-
The plugin complements the central RHACS console rather than replacing it
|
Presenter tip: If the Security menu or tab is missing, confirm the RHACS Operator Console plugin is enabled ( |
Part 4: Exporting RHACS Metrics
Know
Context: Security teams want to export RHACS metrics to their existing monitoring and alerting systems.
What RHACS 5.0 provides:
-
A Prometheus-compatible metrics endpoint at
/metricson the Central API service -
Metrics for vulnerabilities, policy violations, runtime activity, and compliance posture
-
Configurable vulnerability and violation series so teams can tune label cardinality for their environment
-
The same risk signals surfaced in the RHACS portal, exported in a format Prometheus, Grafana, Splunk, and other observability tools can consume
Why metrics export matters for security and platform teams:
Dashboards and ad hoc queries in the RHACS console answer point-in-time questions. Exporting metrics lets teams track trends over weeks and months, correlate security posture with change events, and wire RHACS data into existing on-call alerting — without asking operators to live in a separate portal.
This demo environment installs a sample Perses dashboard in the OpenShift console during setup (monitoring-setup). RHACS exposes /metrics by default; vulnerability and policy violation metrics may need to be enabled under Platform Configuration → System Configuration → Prometheus metrics.
|
For more information, see the Monitoring Red Hat Advanced Cluster Security documentation.
Show
What I say:
"Finally, let me show you how RHACS metrics leave the platform. Security teams often need this data in the same Prometheus, Grafana, or SIEM stack they already use for infrastructure monitoring. RHACS exposes a standard metrics endpoint, and in OpenShift you can visualize trends right in the console."
What I do:
-
Go to the webpage URL: {openshift_cluster_console_url}/monitoring/v2/dashboards/view?dashboard=sample-stackrox-dashboard&project=stackrox&var-Cluster=production&var-Namespace=apache-struts&start=30d&refresh=1m
"This is the sample RHACS dashboard in the OpenShift console, delivered through Perses. It is scoped to the apache-struts namespace so you can see vulnerability and policy posture for a workload your teams already care about."
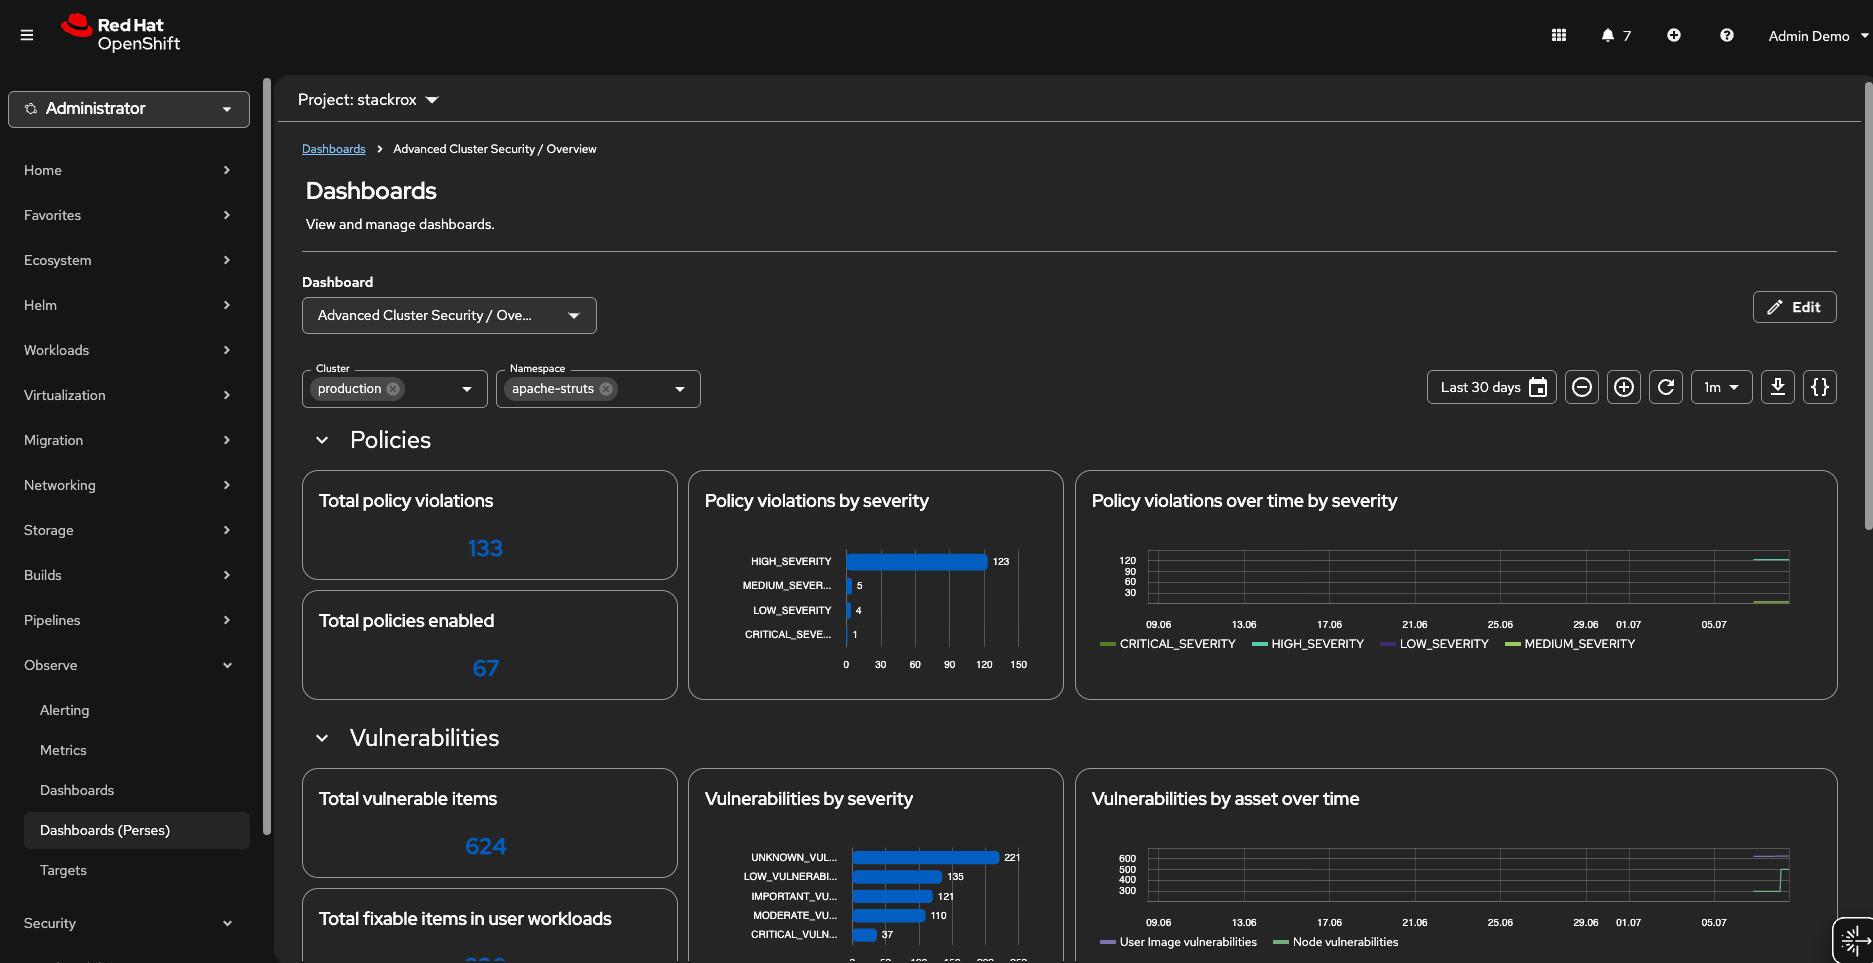 Figure 4. OpenShift console Perses dashboard showing RHACS metrics
-
Point out the panels showing vulnerability severity, policy violations, and certificate health:
"These charts are backed by Prometheus scraping RHACS Central on
/metrics. The same data can feed Grafana dashboards, OpenShift alerts, or downstream tools like Splunk — whatever your organization standardizes on." -
Mention the metrics endpoint for teams that scrape directly:
"The underlying endpoint is Prometheus-compatible. Platform teams authenticate with client certificates or API tokens, then point their scraper at Central
/metrics. You configure which vulnerability and violation series to expose so cardinality stays manageable."
What they should notice:
-
RHACS metrics appear in OpenShift under Observe dashboards (Perses), not only in the RHACS portal
-
The dashboard supports cluster and namespace filters for scoped trend analysis
-
Exported metrics enable long-term trending and external alerting on security posture
-
The same data can be consumed by Grafana, Splunk, and other tools that ingest Prometheus metrics
|
Presenter tip: If asked where metrics live in OpenShift, clarify that Observe → Metrics uses platform Prometheus. RHACS metrics from this demo stack appear under Observe → Dashboards with the RHACS Prometheus datasource. If panels show no data, confirm Prometheus metrics are enabled in RHACS system configuration and that the monitoring setup completed successfully. |
|
Transition: Next we dive into vulnerability management — the first workflow most teams want to explore in depth. |