Navigating RHACS
1. Module Goals
-
Understand the various modules in RHACS.
-
Comfortably navigate the UI.
-
Set the foundation for exploring the rest of the modules in the roadshow.
-
Help you come up with questions for the RHACS team.
2. RHACS Basics
RHACS provides the tools and capabilities to address the security needs of a cloud-native development approach on Kubernetes. These security features represent any developer or administrator’s primary work across various environments, including multiple datacenters, private clouds, or public clouds that run Kubernetes clusters.
2.1. RHACS features
Using Red Hat Advanced Cluster Security for Kubernetes, you can gain comprehensive Kubernetes security that includes the following use cases:
-
Visibility: See your entire landscape of images, registries, containers, deployments, and runtime behavior.
-
Vulnerability Management: Identify and remediate vulnerabilities in container images and Kubernetes across the entire software development life cycle.
-
Compliance: Audit your systems against CIS Benchmarks, NIST, PCI, and HIPAA, with interactive dashboards and one-click audit reports.
-
Network Security: Visualize existing connections and enforce tighter segmentation using Kubernetes-native controls to reduce your blast radius.
-
Security Policy Guardrails: See all your deployments ranked by risk level, using context from Kubernetes' declarative data, to prioritize remediation.
-
Configuration Management: Apply best practices for Docker and Kubernetes to harden your environment for a more secure and stable application.
-
Threat Detection: Use rules, automated allow lists, and baselining to identify suspicious activity in your running applications accurately.
-
Incident Response: Take action, from failing builds and blocking deployments to killing pods and thwarting attacks, using Kubernetes for enforcement.
3. Introduction to the RHACS Console
This module focuses on navigation and search in the RHACS UI. You will use the dashboard, walk through each major use case, and finish with a hands-on incident exercise.
3.1. Navigating the RHACS Console
In this section, you familiarize yourself with the RHACS console, including its tabs, search capabilities, and dashboard functionality.
The "Dashboard" or RHACS home page has 3 sections:
-
Navigation bar
-
Navigation drawer
-
Dashboard
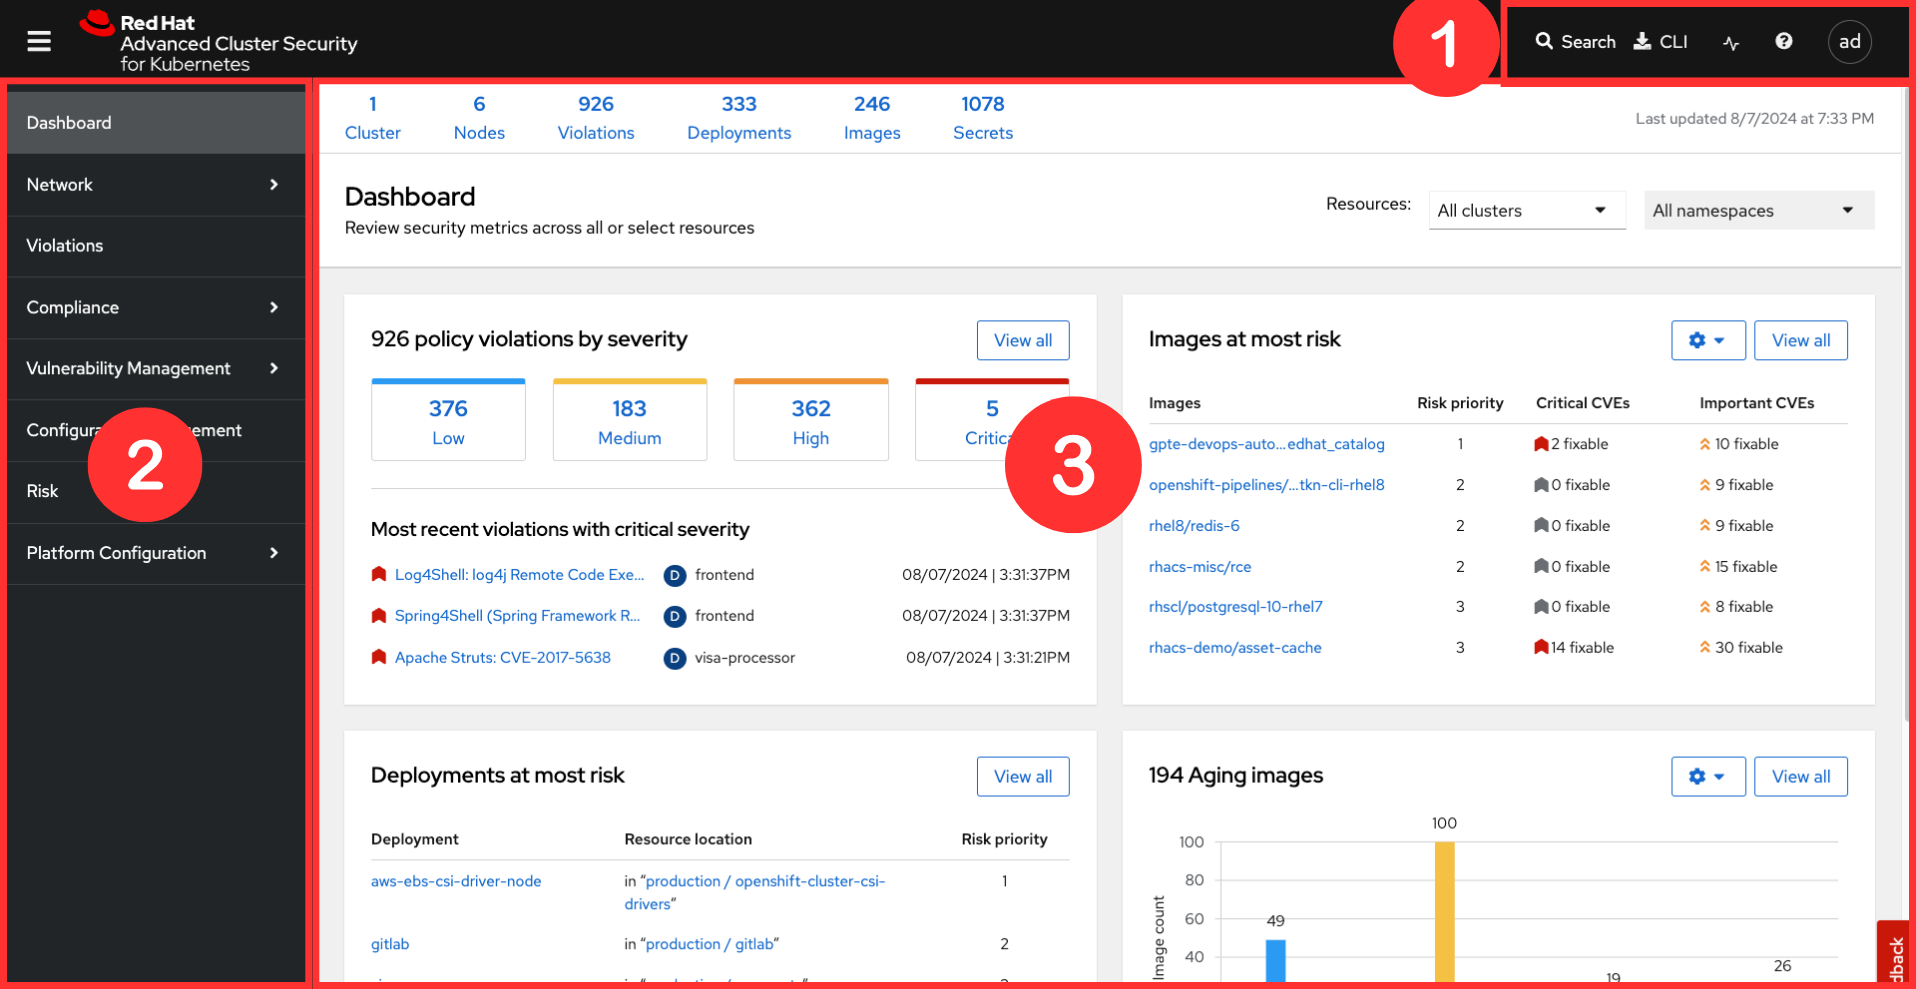
3.2. 1. Navigation Bar
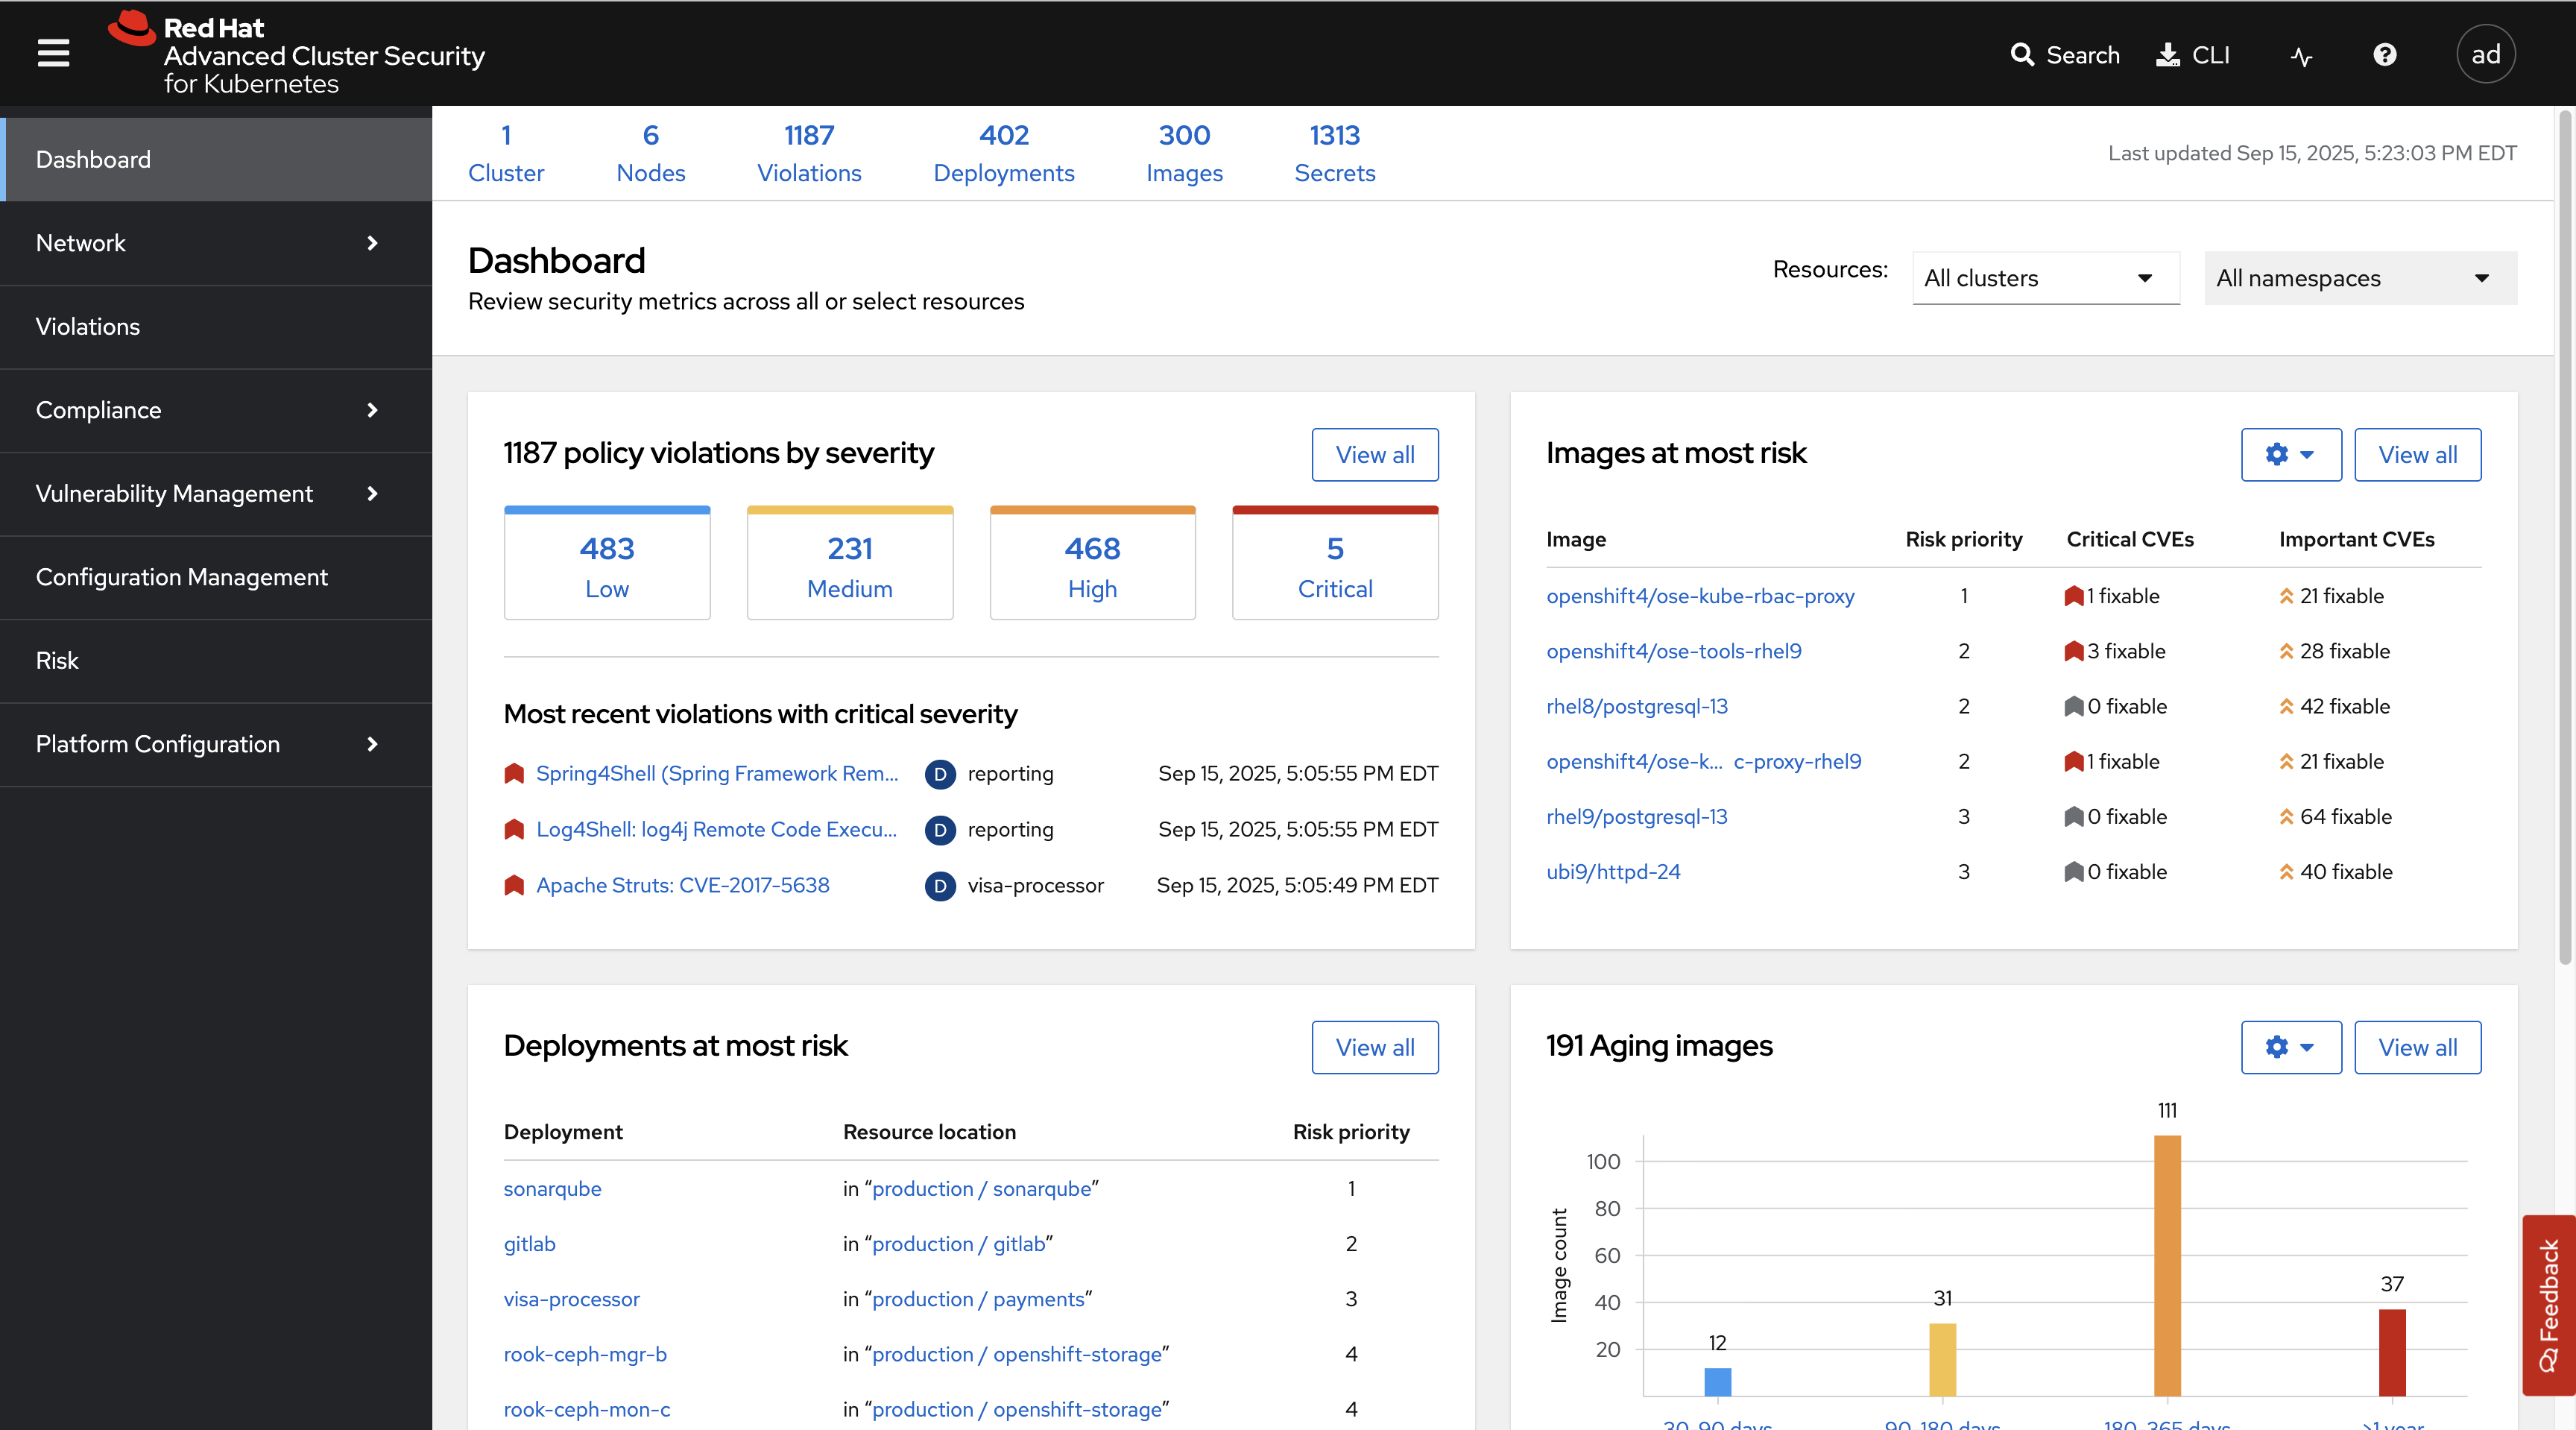
The top bar contains the following functionality:
-
Global search
-
Command-line tools
-
Cluster health
-
Documentation
-
API reference
-
Enable dark/light mode
-
Logged-in user account
3.3. Global Search
The ability to instantly find resources is essential to safeguard your cluster. Utilize the RHACS search feature to find relevant resources faster. For example, you can use it to find deployments exposed to a newly published CVE or all deployments with external network exposure.
3.3.1. A search query
A search query consists of two parts:
-
An attribute that identifies the resource type you want to search for.
-
A search term that finds the matching resource.
For example, to find all violations in the frontend deployment, the search query is select Deployment THEN frontend.
In this search query, Deployment is the attribute, and frontend is the search term.
| The search field in RHACS requires each attribute to be entered fully as a search term. Enter your first attribute, and hit the <tab> key to move along to the following attribute you would like to enter. Watch the video below for a demonstration. |
| RHACS maintains a library of searchable assets to help you search faster. They will appear in a drop-down list, and you can click on them to enter them as well. If a specific CVE or deployment cannot be found, please confirm the spelling of the asset name or that it is correctly deployed in the cluster. |
You can also search using REGEX-like capabilities. Add an r/ before the search term—for example, Namespace:r/st.*x matches stackrox and stix.
3.3.2. Common Search Queries
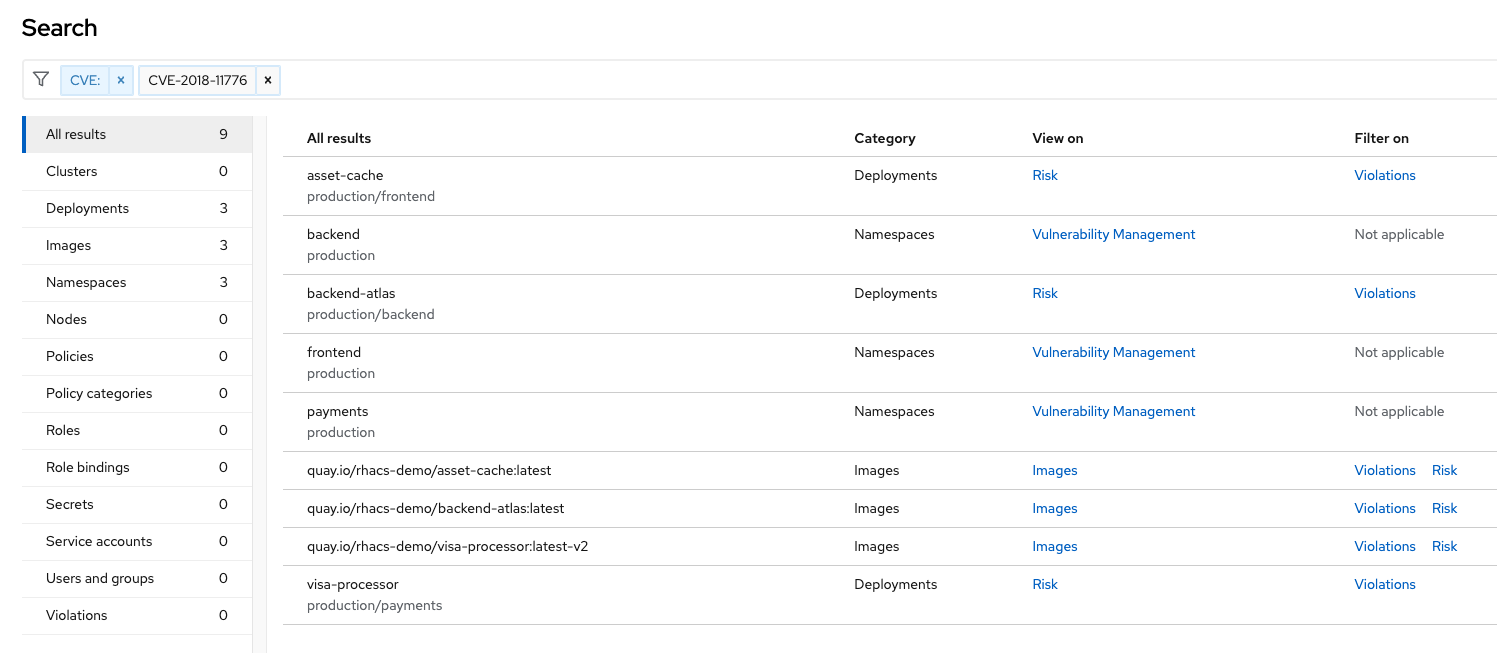
Here are some common search queries you can try in the RHACS search bar if you’d like to test its functionality.
Query |
Example |
Purpose |
CVE:<CVE_number> |
CVE:CVE-2018-11776 |
Finding deployments that are affected by a specific CVE |
Privileged:<true_or_false> |
Privileged:true |
Finding privileged running deployments |
Exposure Level:<level> |
Exposure Level:External |
Finding deployments that have external network exposure |
| RHACS, like Kubernetes, works on a key:value system primarily due to its flexibility and power in organizing, selecting, and managing resources, but also because of the ability to set selectors and match objects based on a set of values (e.g., 'in', 'not in', 'exists', 'does not exist'). |
3.3.3. Local Page Filtering
Each RHACS view also supports local filtering with the same syntax as global search (including r/ regex). Attributes are limited to what is relevant on that page—for example, filtering violations by namespace.
Local filters apply only to the current view; global search spans the entire RHACS inventory.
3.4. Navigation Menu
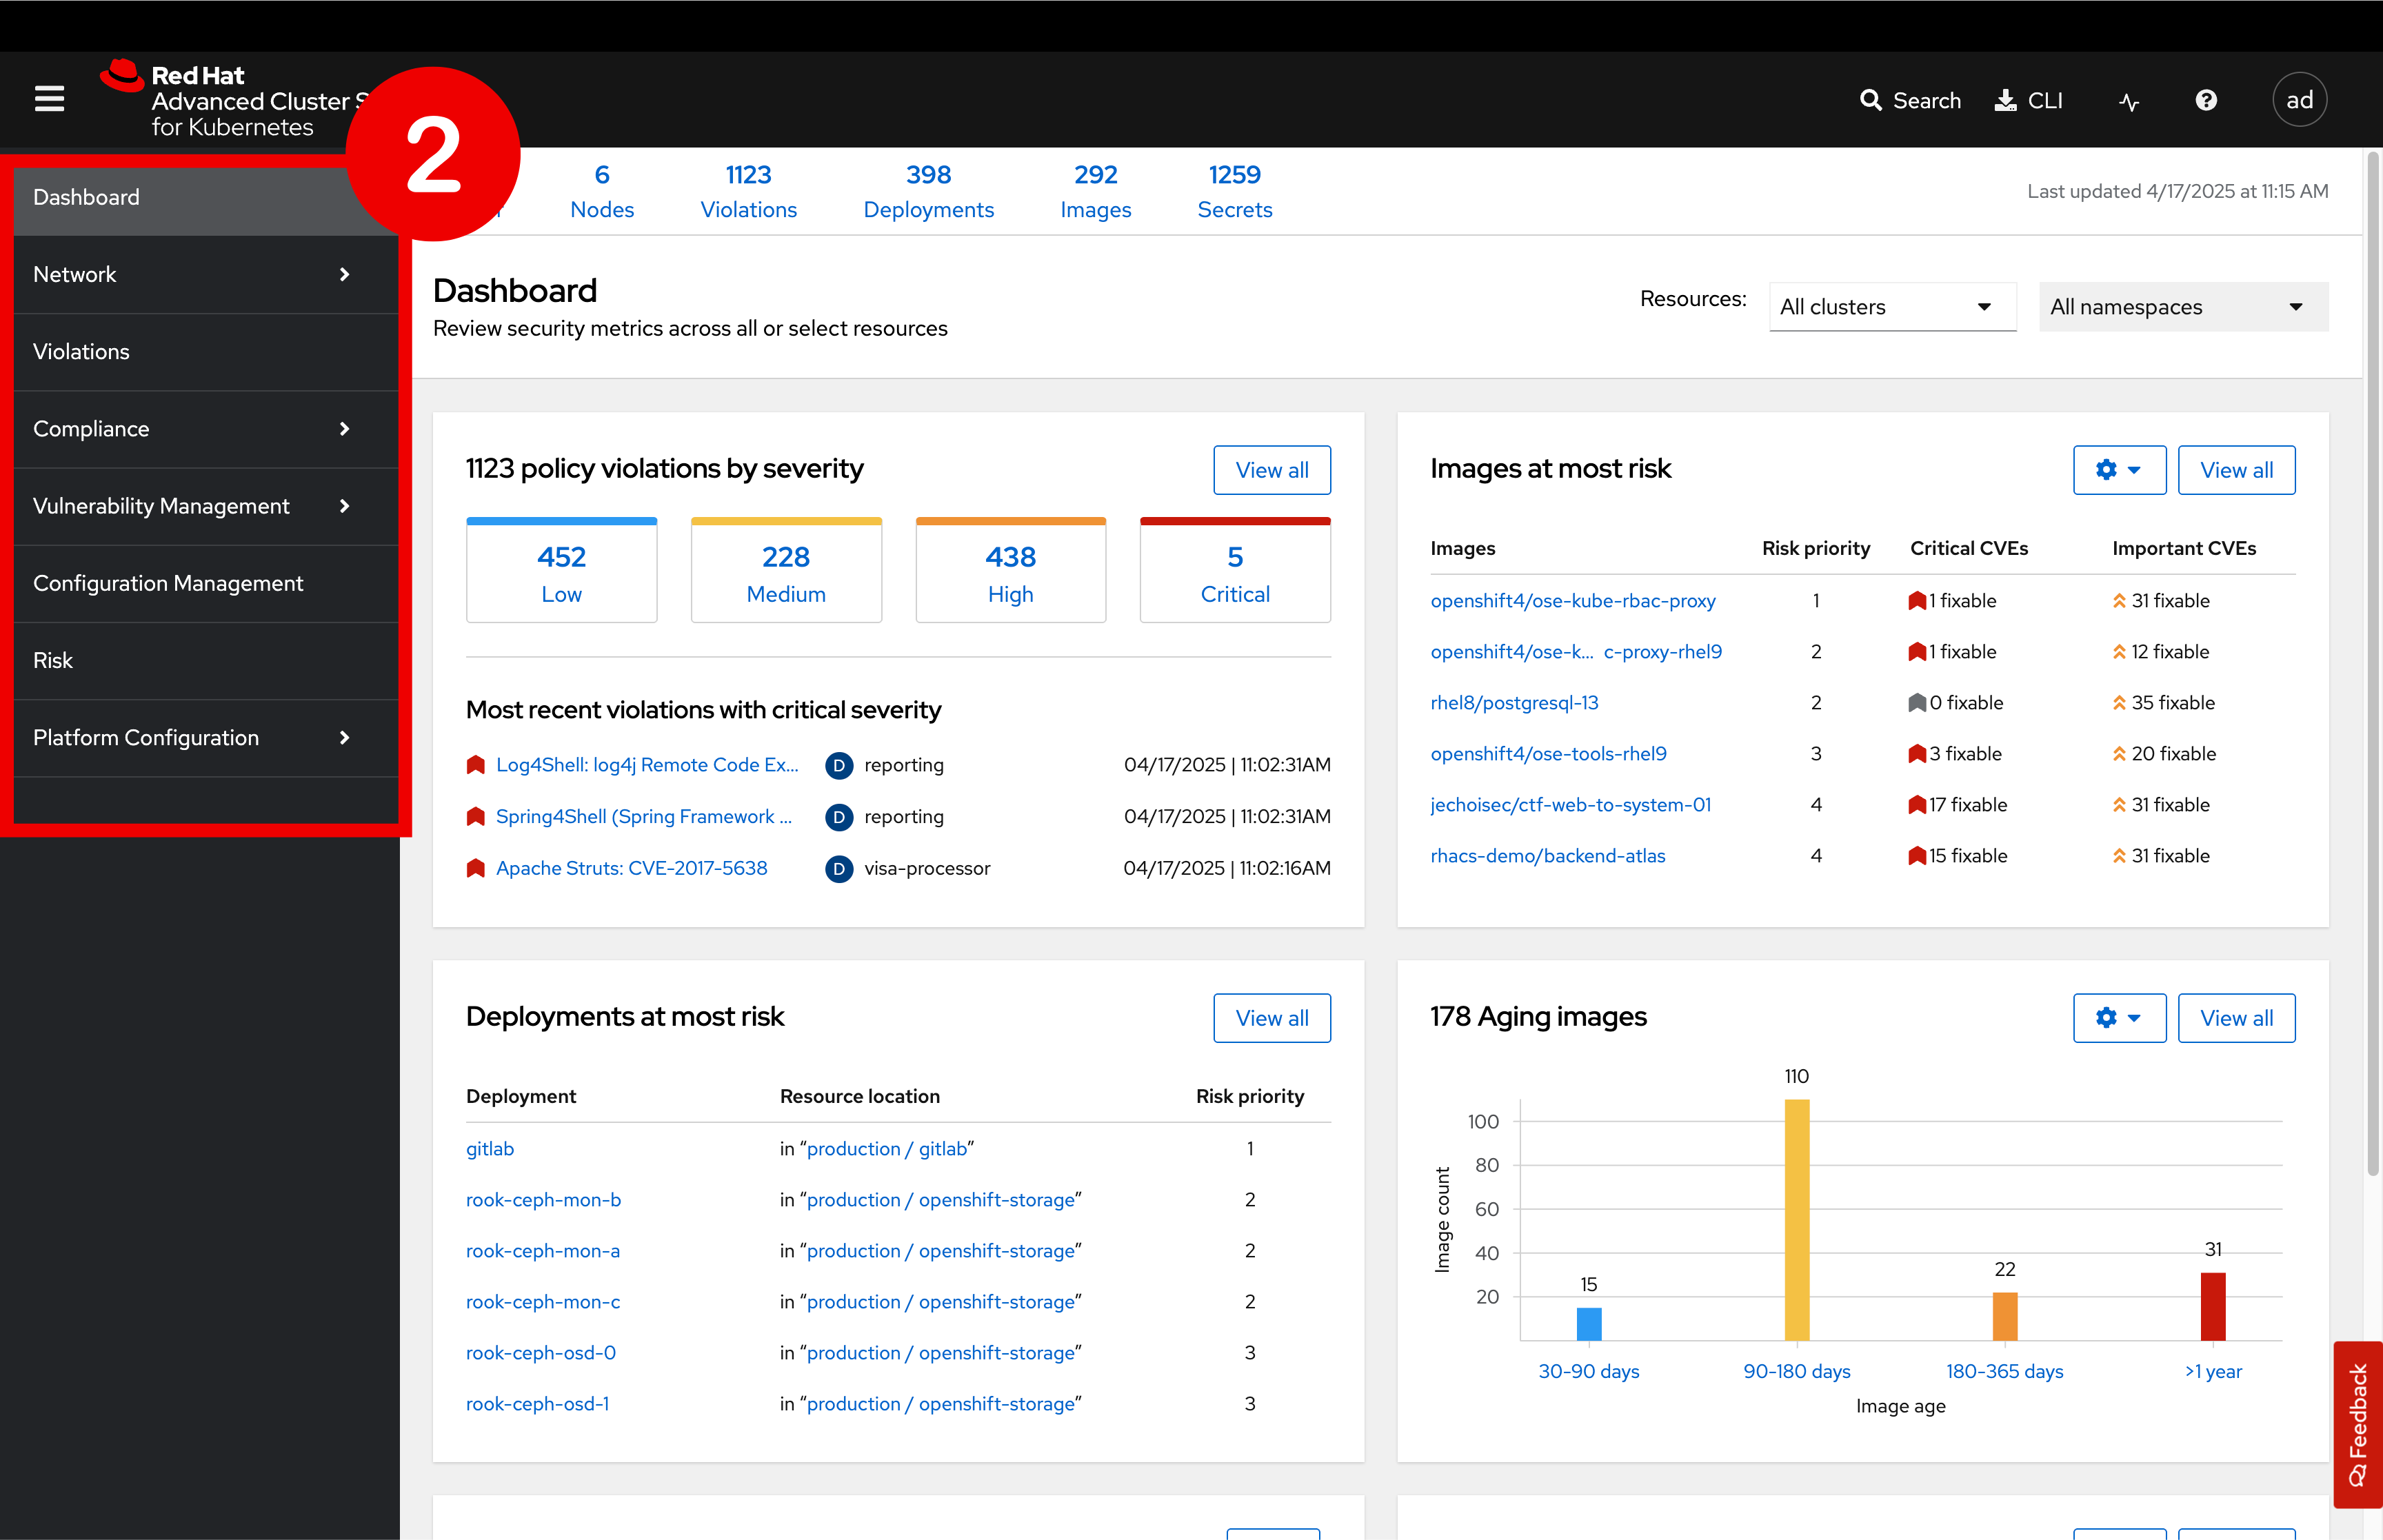
The left-hand navigation menu provides access to each of the security use cases, as well as product configuration to integrate RHACS with your existing tooling. The navigation menu has the following items:
-
Dashboard: Summary view of your environment
-
Network Graph: Network flows, listening endpoints, and policy simulation
-
Violations: Policy violation events and enforcement status
-
Compliance: CIS, PCI-DSS, and STIG coverage, schedules, and dashboards
-
Vulnerability Management: Workload, platform, and node CVE views
-
Configuration Management: Misconfiguration and standards reporting
-
Risk: Prioritized workloads using config, runtime, and vulnerability context
-
Platform Configuration: Clusters, policies, collections, integrations, access control, and system settings
3.5. Dashboard
The RHACS dashboard provides at-a-glance counters, cluster/namespace filtering, and customizable widgets for risk, compliance, violations, and CVEs.
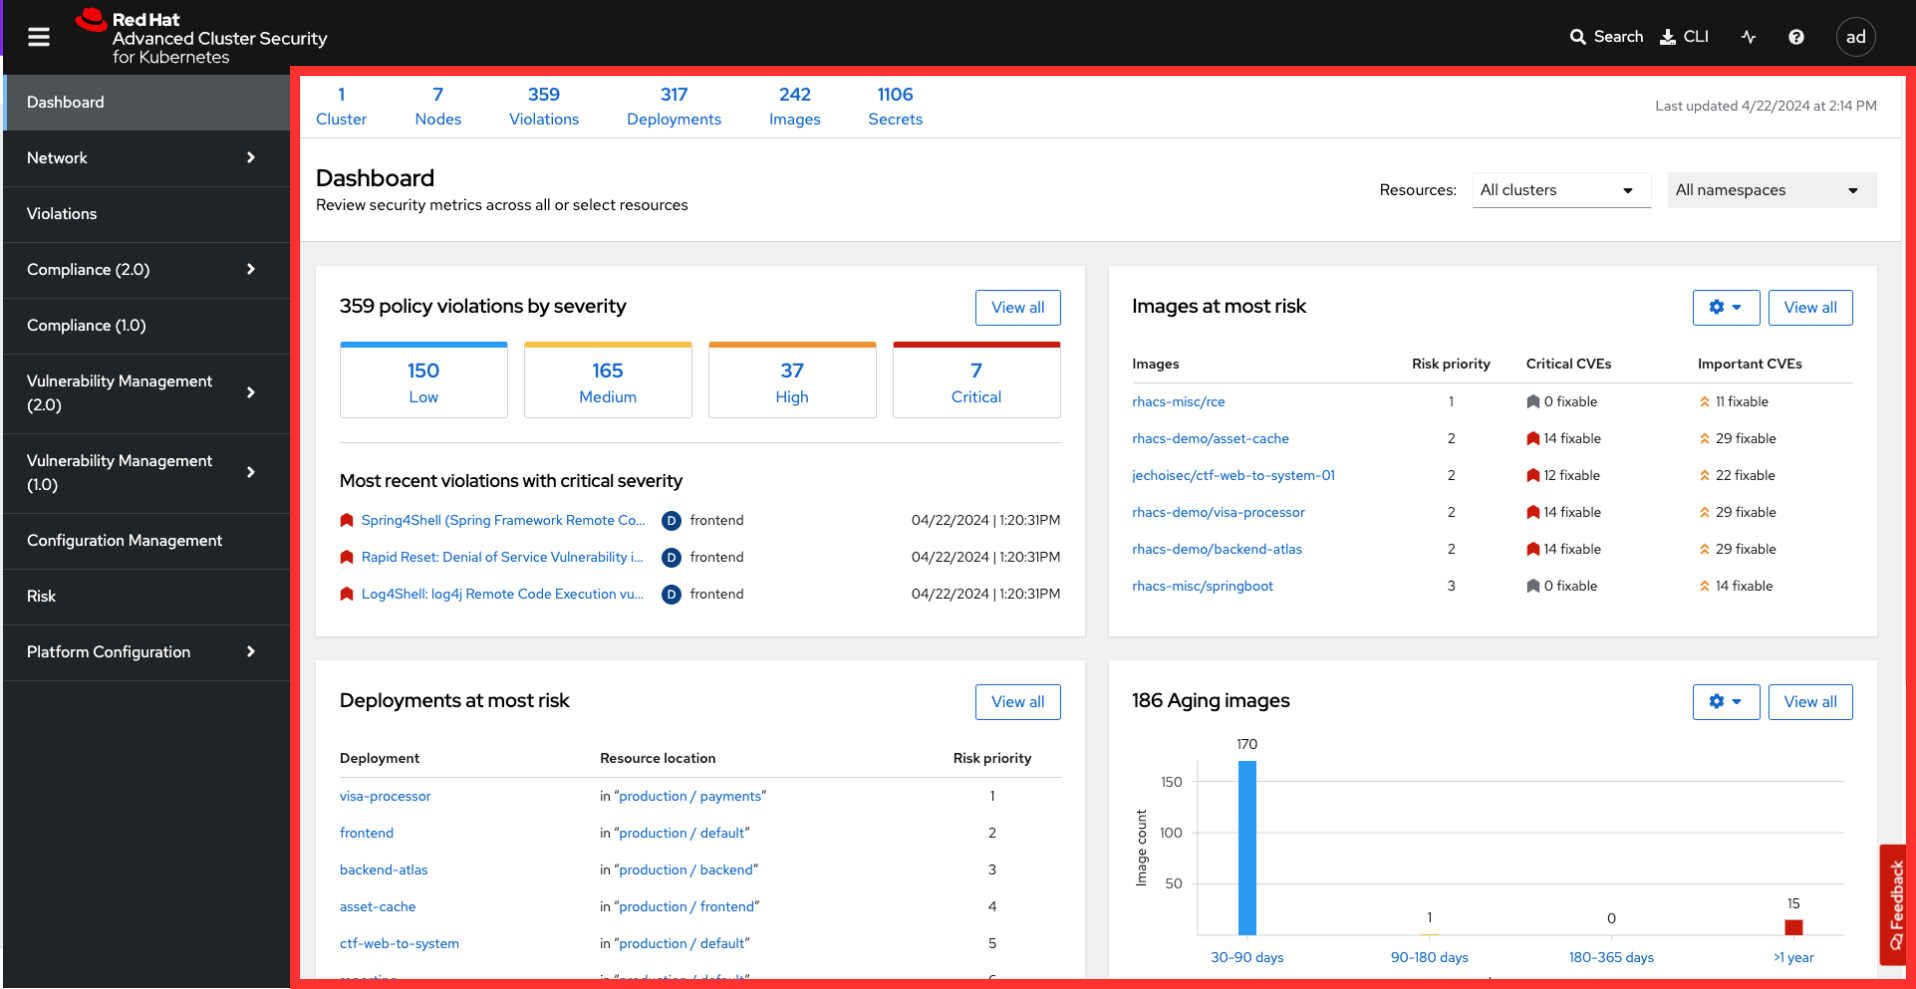
The dashboard has three sections: the status bar, the dashboard filter, and actionable widgets.
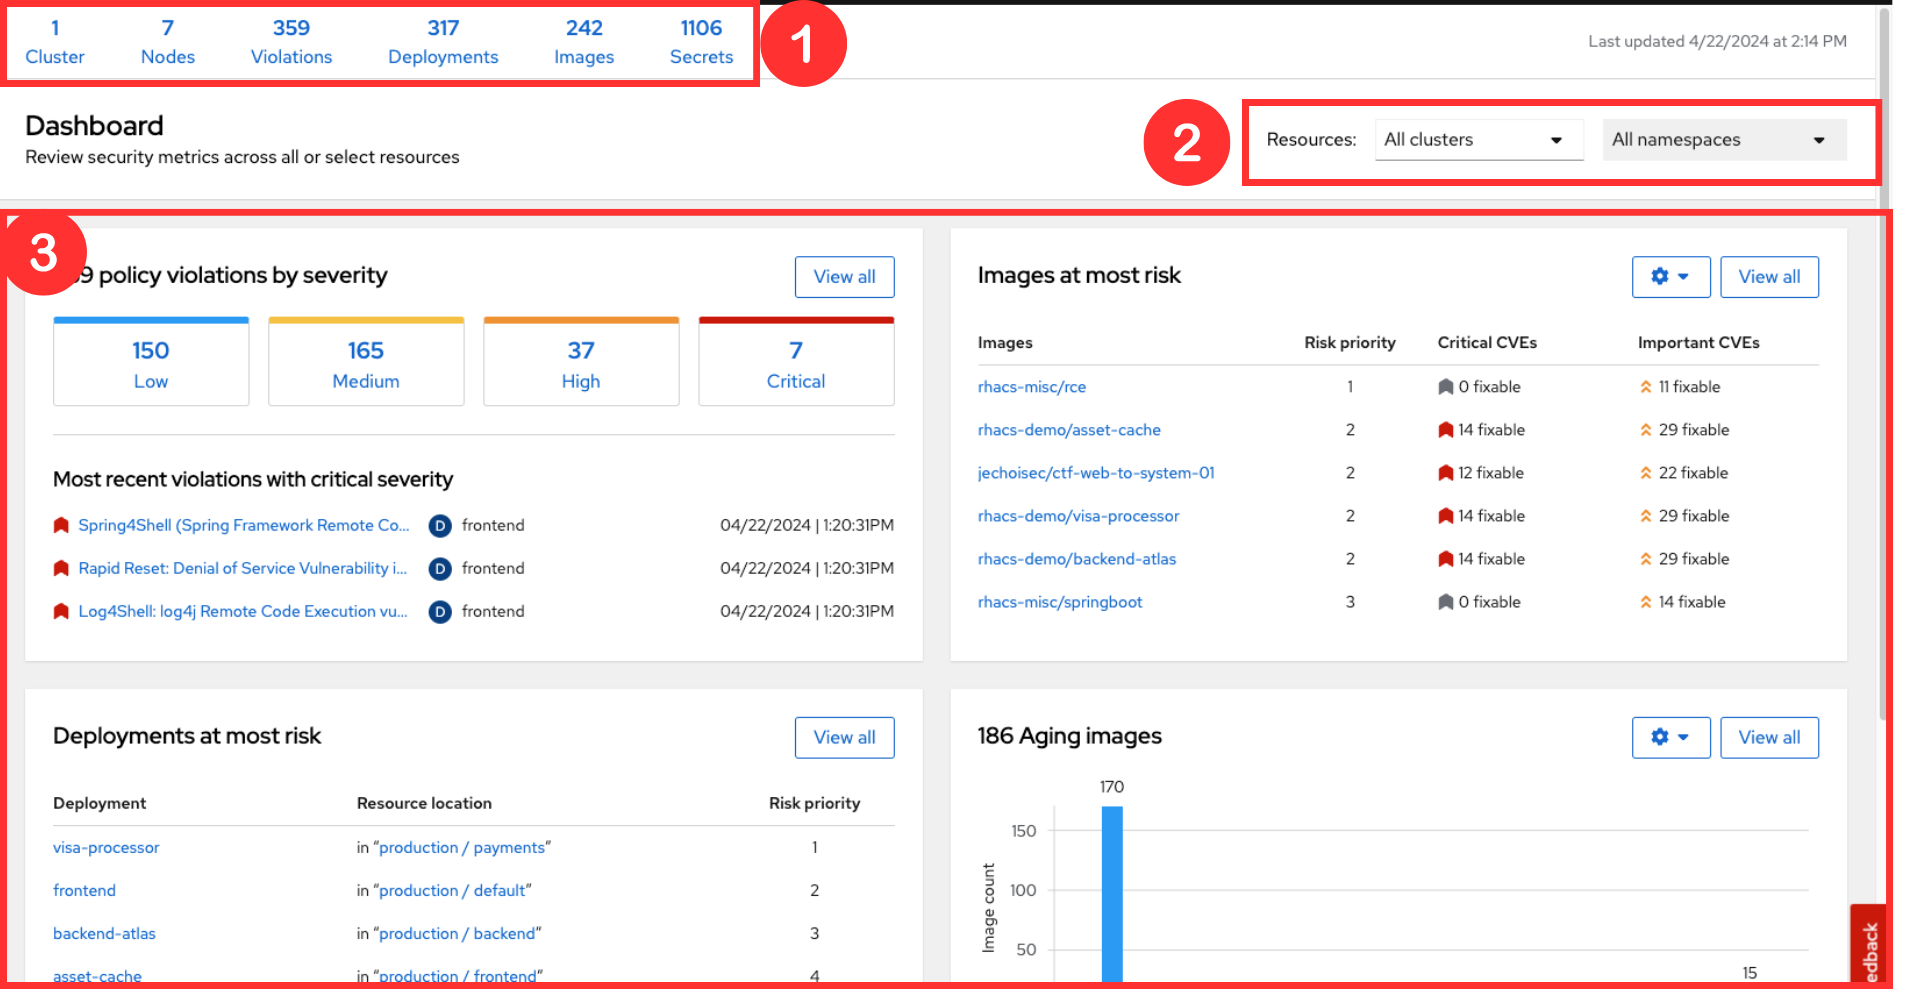
3.5.1. The Status Bar
The status bar provides at-a-glance numerical counters for critical resources. The counters reflect what is visible with your current access scope, defined by the roles associated with your user profile.
These counters are clickable, providing fast access to the desired list view pages as follows:
Counter |
Destination |
Clusters |
Platform Configuration → Clusters |
Nodes |
Configuration Management → Applications & Infrastructure → Nodes |
Violations |
Violations Main Menu |
Deployments |
Configuration Management → Applications & Infrastructure → Deployments |
Images |
Vulnerability Management → Dashboard → Images |
Secrets |
Configuration Management → Applications & Infrastructure → Secrets |
3.5.2. The Dashboard Filter
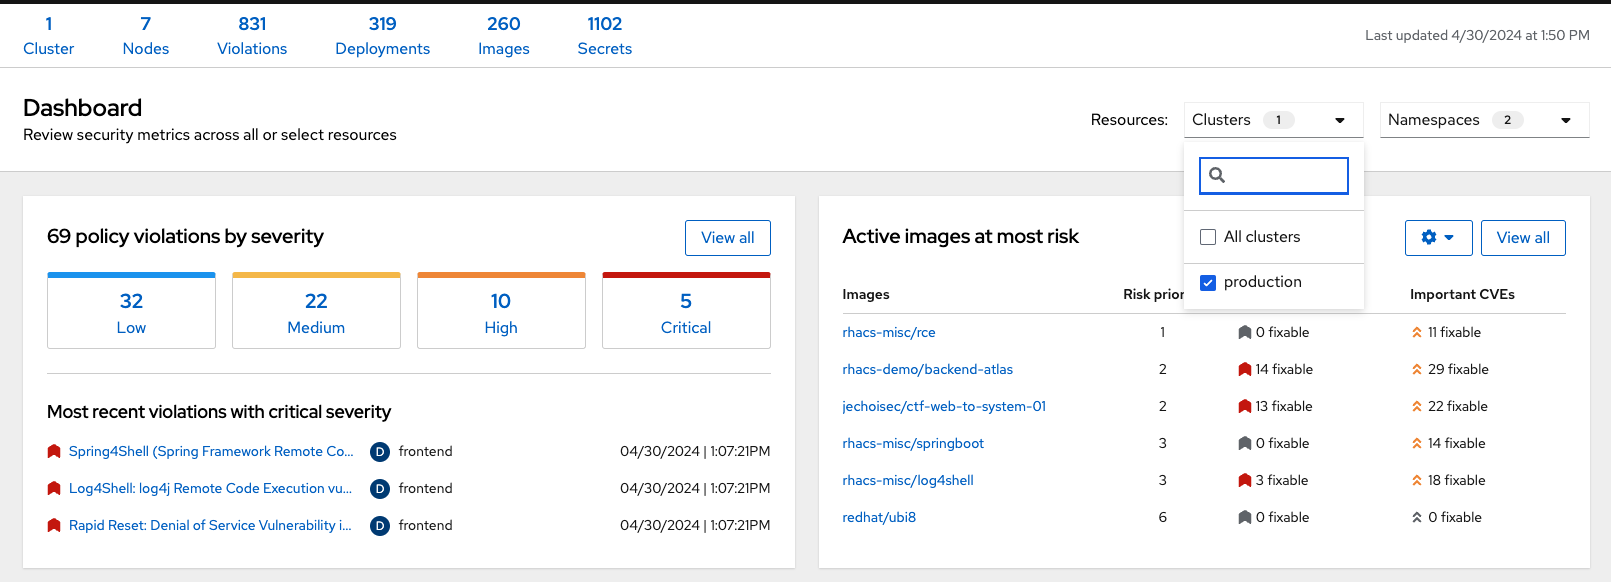
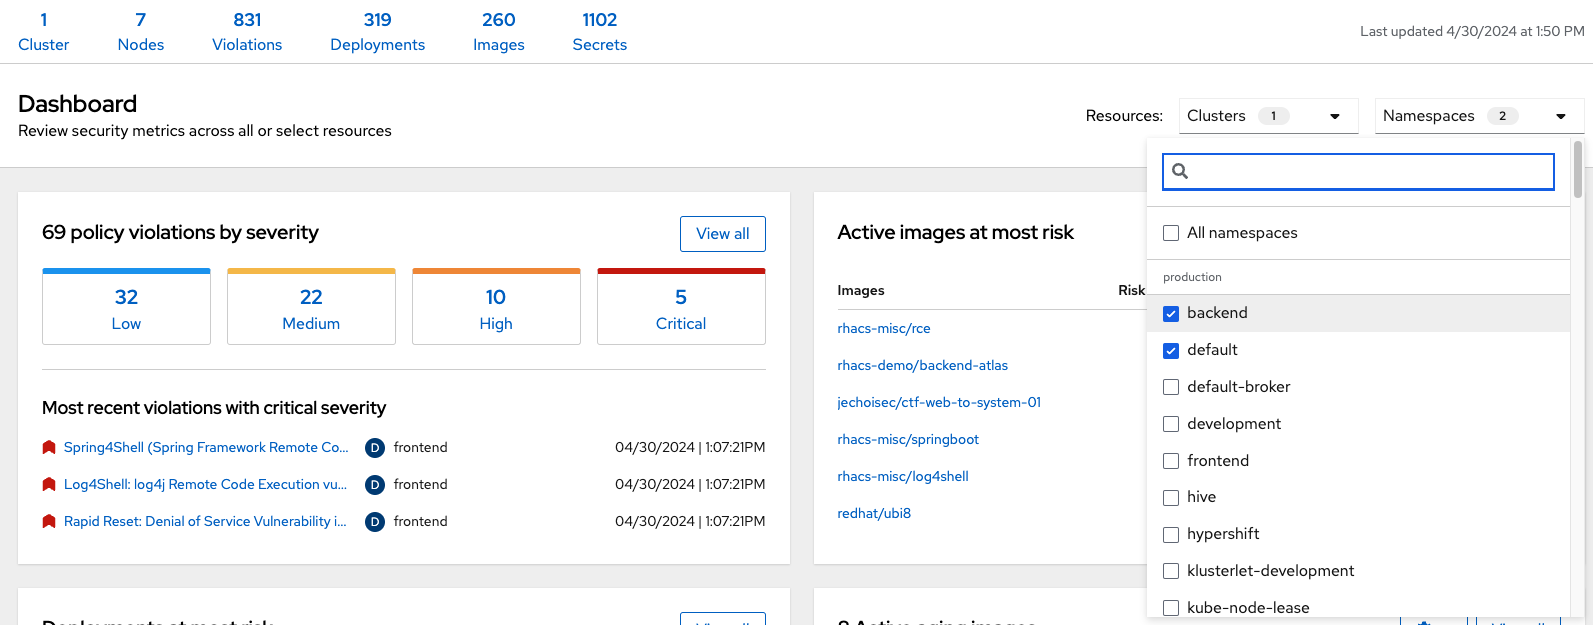
The dashboard includes a top-level filter that applies simultaneously to all widgets. You can select clusters and one or more namespaces within selected clusters. Any change to the filter is immediately reflected by all widgets, limiting the data they present to the selected scope.
| The dashboard filter does not affect the status bar. When no clusters or namespaces are selected, the view shows All. |
4. Navigating the Main Use Cases
We are going to work from the top down throughout the ACS dashboard to give you an overview of all of the use cases that ACS will cover, starting with the network UI.
4.1. Network Security
The network user interface contains two drop-downs: the Network Graph tab and the Listening Endpoints tab.
Click on the Network Graph tab
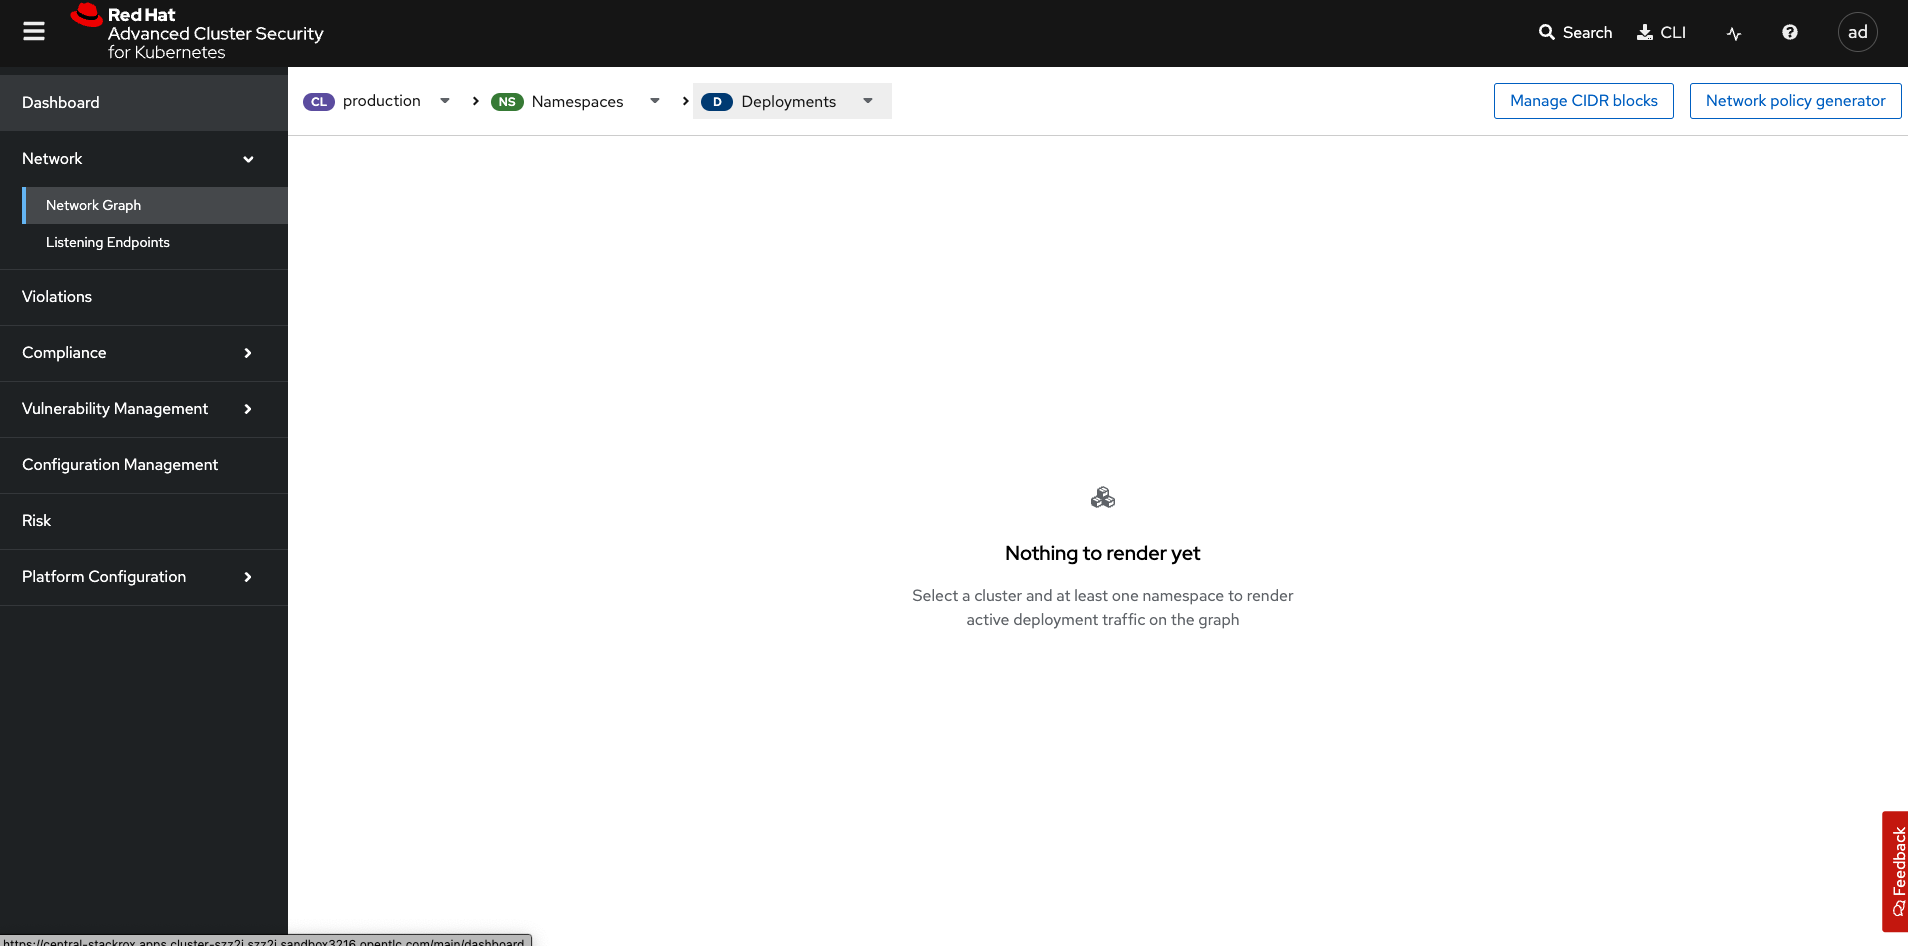
| RHACS may show a compatibility warning for AdminNetworkPolicy (ANP), BaselineAdminNetworkPolicy (BANP), or CNI-specific resources—the Network Graph may not represent those flows. |
To see results, sort by Cluster → Namespace → Deployment. Try Production + patient-portal
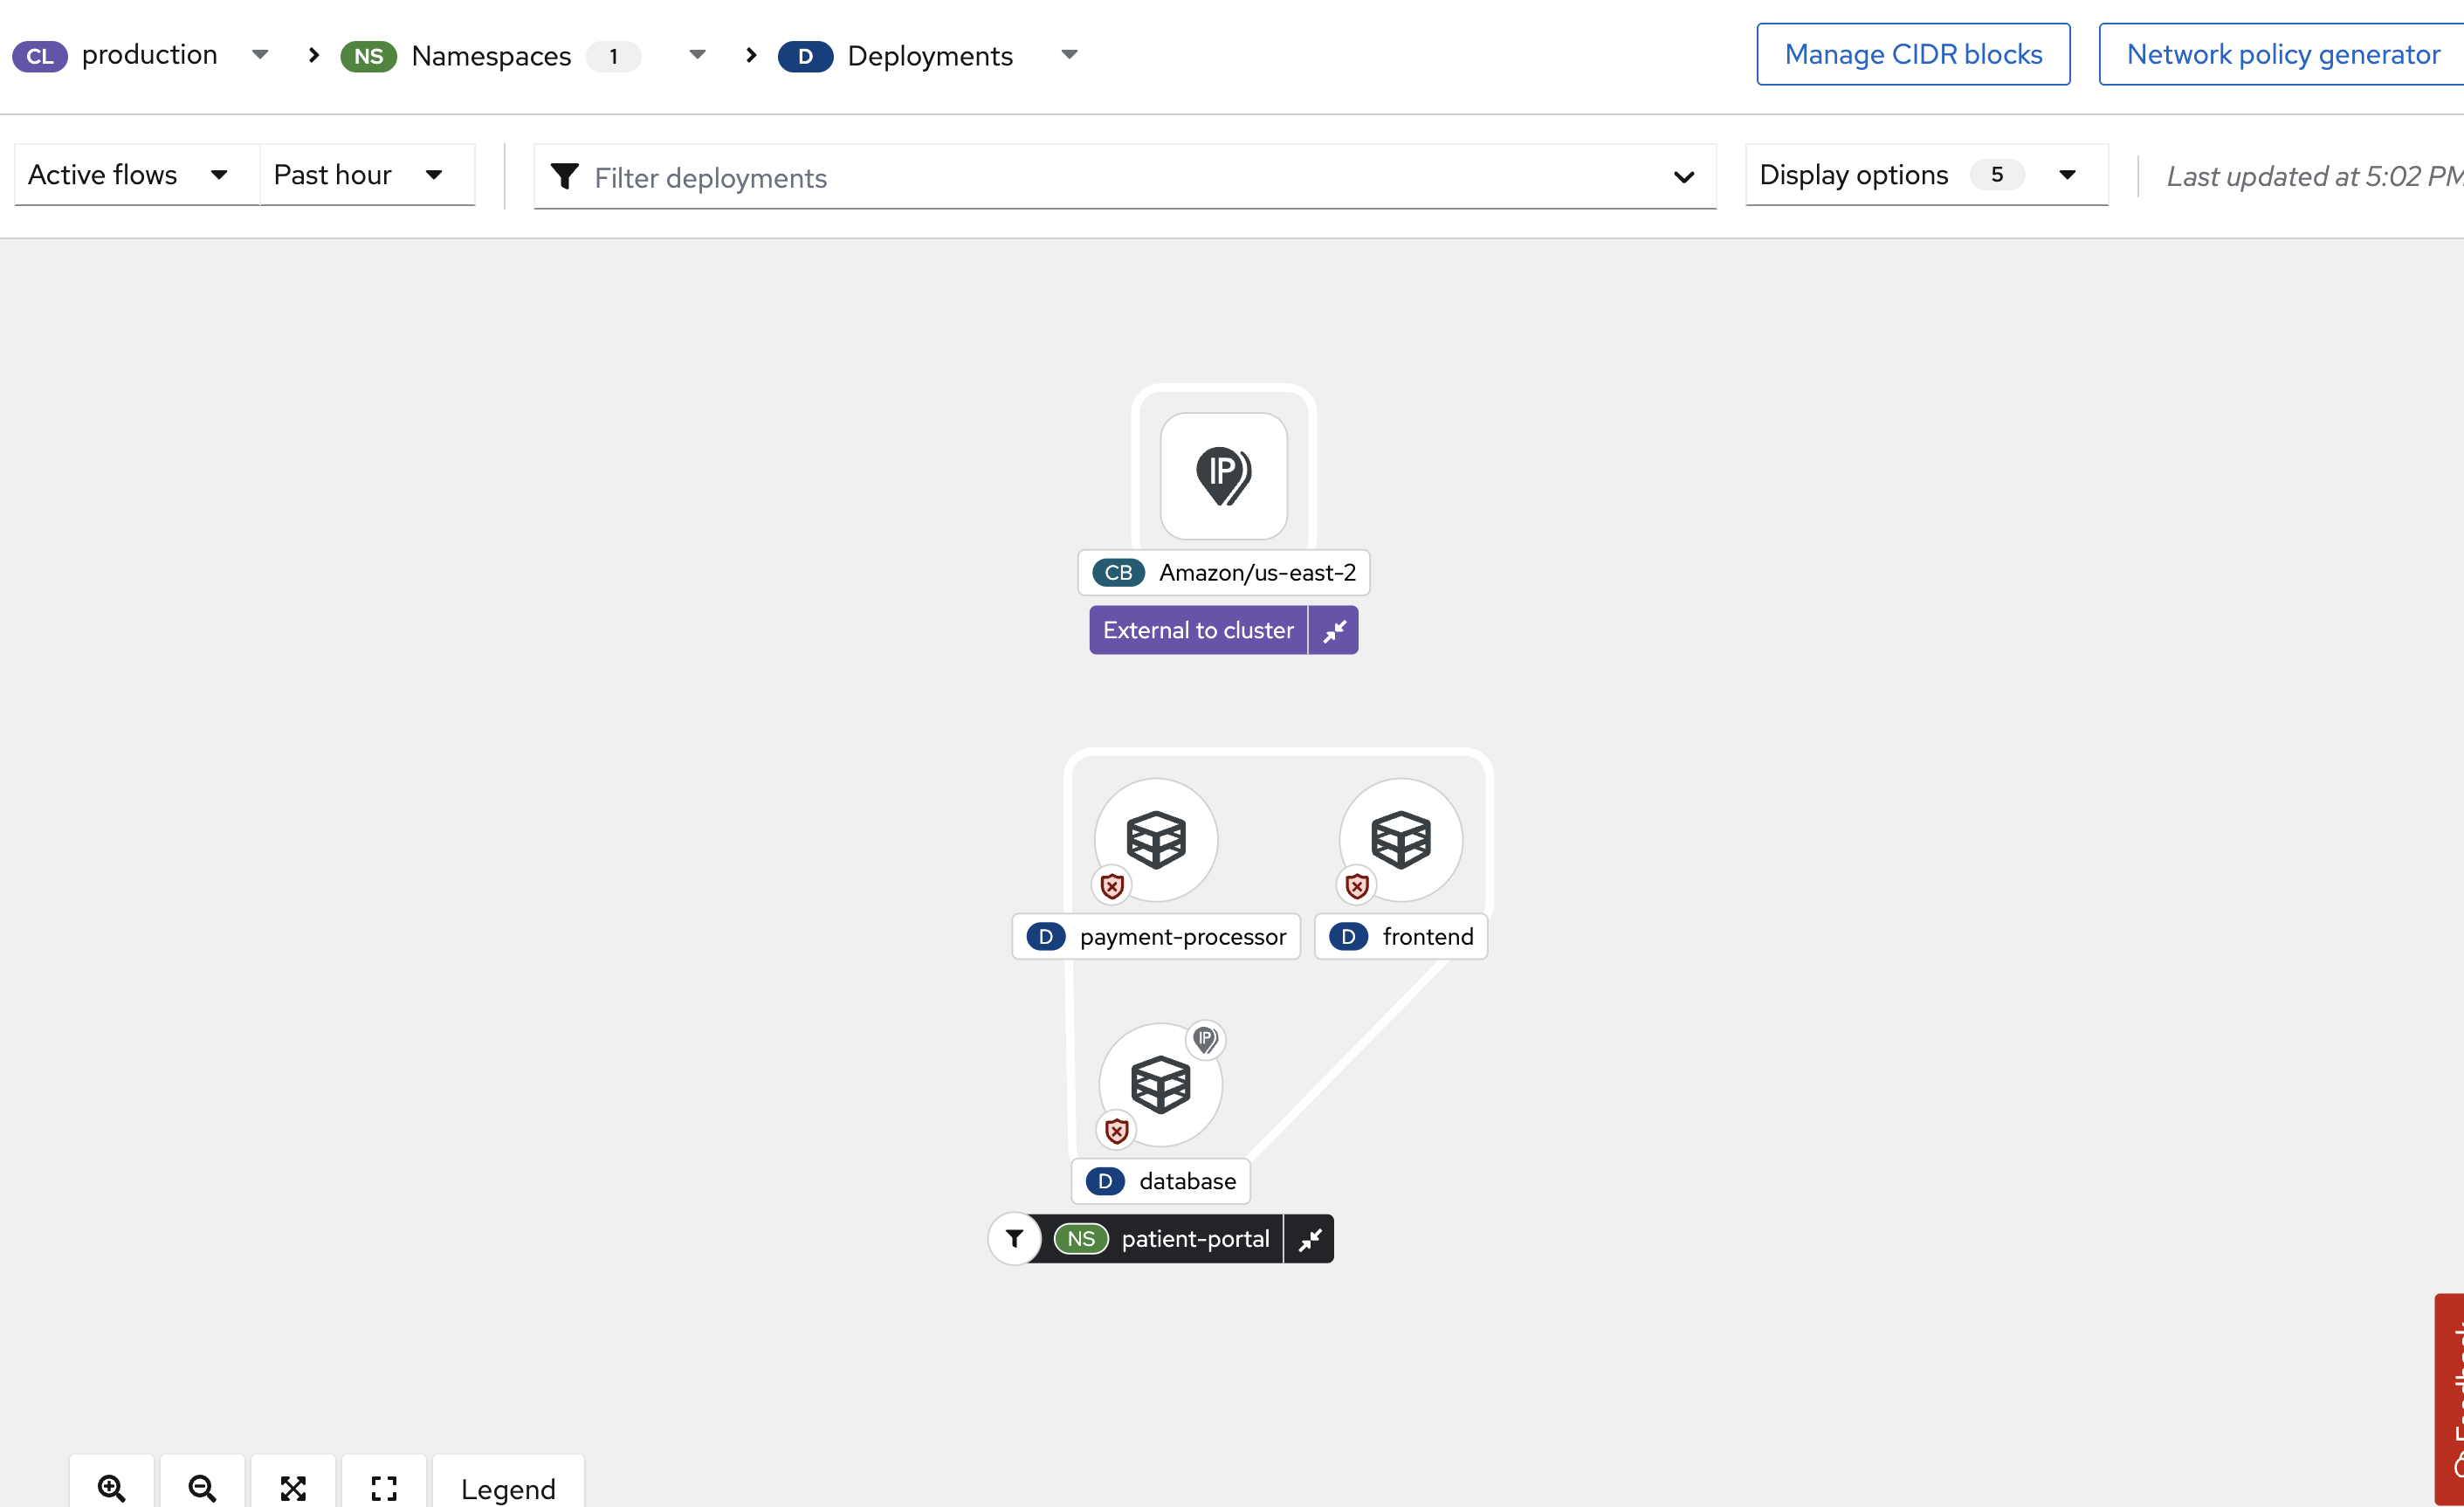
The network graph tab allows you to visualize all the network connections in your cluster, look at baseline flows, simulate network policies, manage CIDR blocks, and more.
| With the externalIP feature enabled, you will see the externalIPs in the Network Graph. Since we are running this lab in AWS, you will see the external network flows into the cluster. |
Click on the Listening Endpoints tab
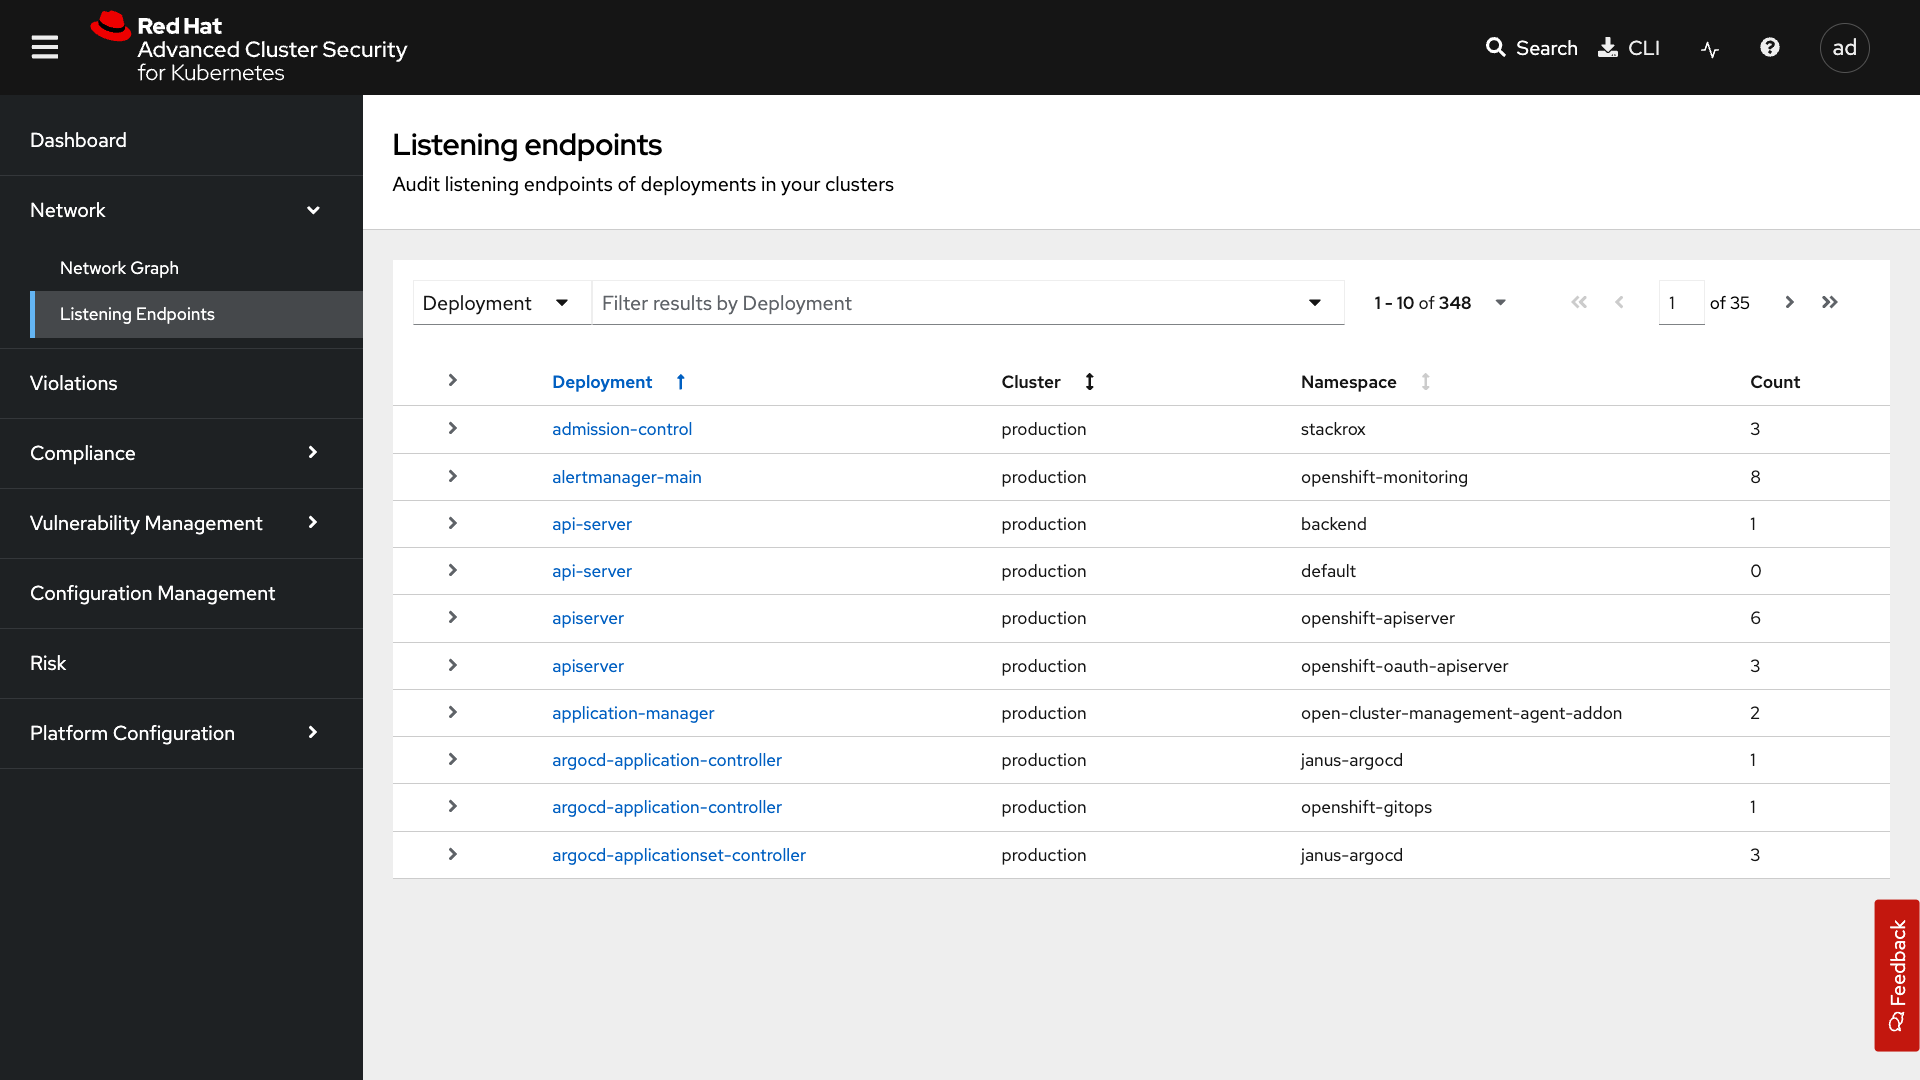
With the Listening Endpoints tab, you can see all of the deployments across your clusters and audit for any reported listening endpoints. As you drill down through cluster, namespace, and into deployments, you will see the exact process ID, port, protocol, pod ID, container name, and whether they are exposed.
4.2. Violations
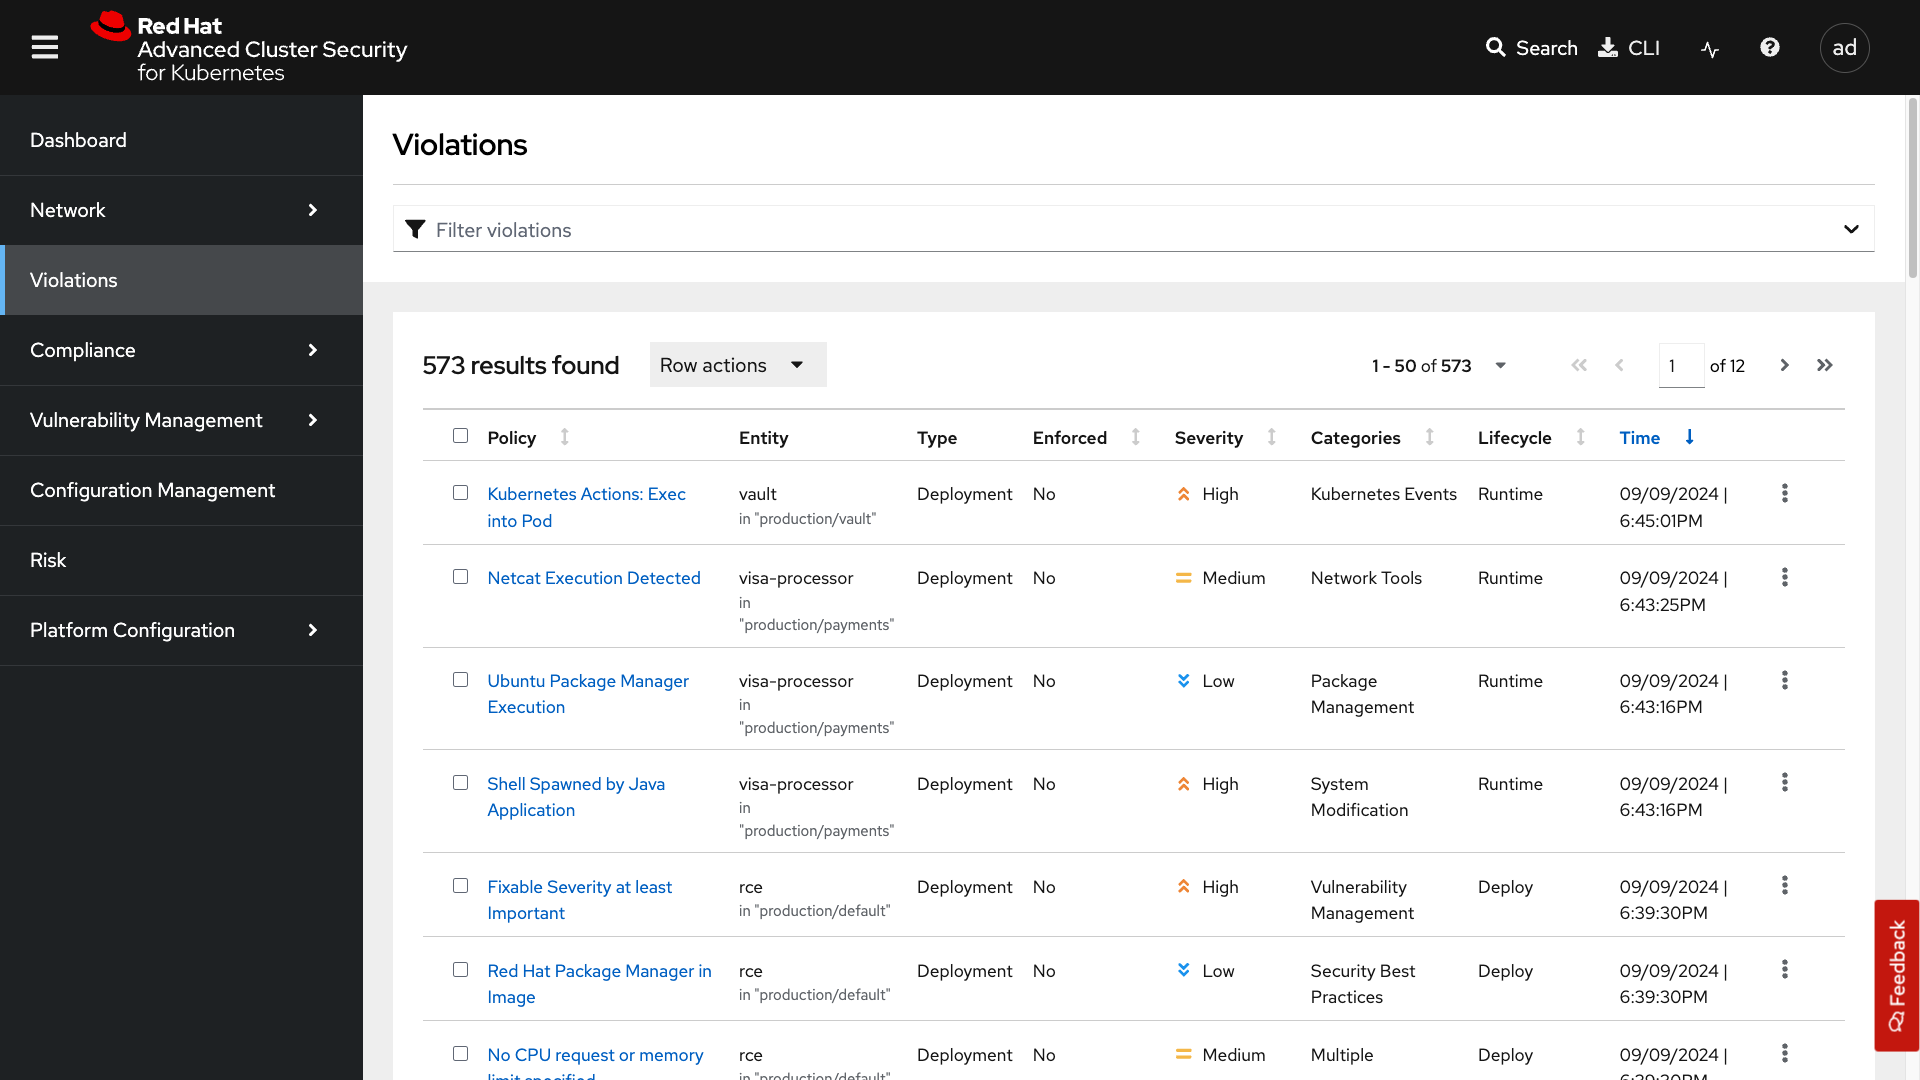
The Violations tab lists policy violations. Each row shows the policy, affected entity, severity, category, lifecycle stage, enforcement status, and timestamp. You will work through this workflow in later modules.
4.3. Compliance
RHACS integrates with the OpenShift Compliance Operator to measure CIS, PCI-DSS, and DISA STIG posture. You will install and manage scans in a later module.
The Compliance menu has three tabs:
-
Coverage — scanned clusters and workloads after the operator is configured
-
Schedules — recurring scans against CIS, PCI-DSS, and DISA STIG profiles
-
Dashboard — compliance posture at a glance
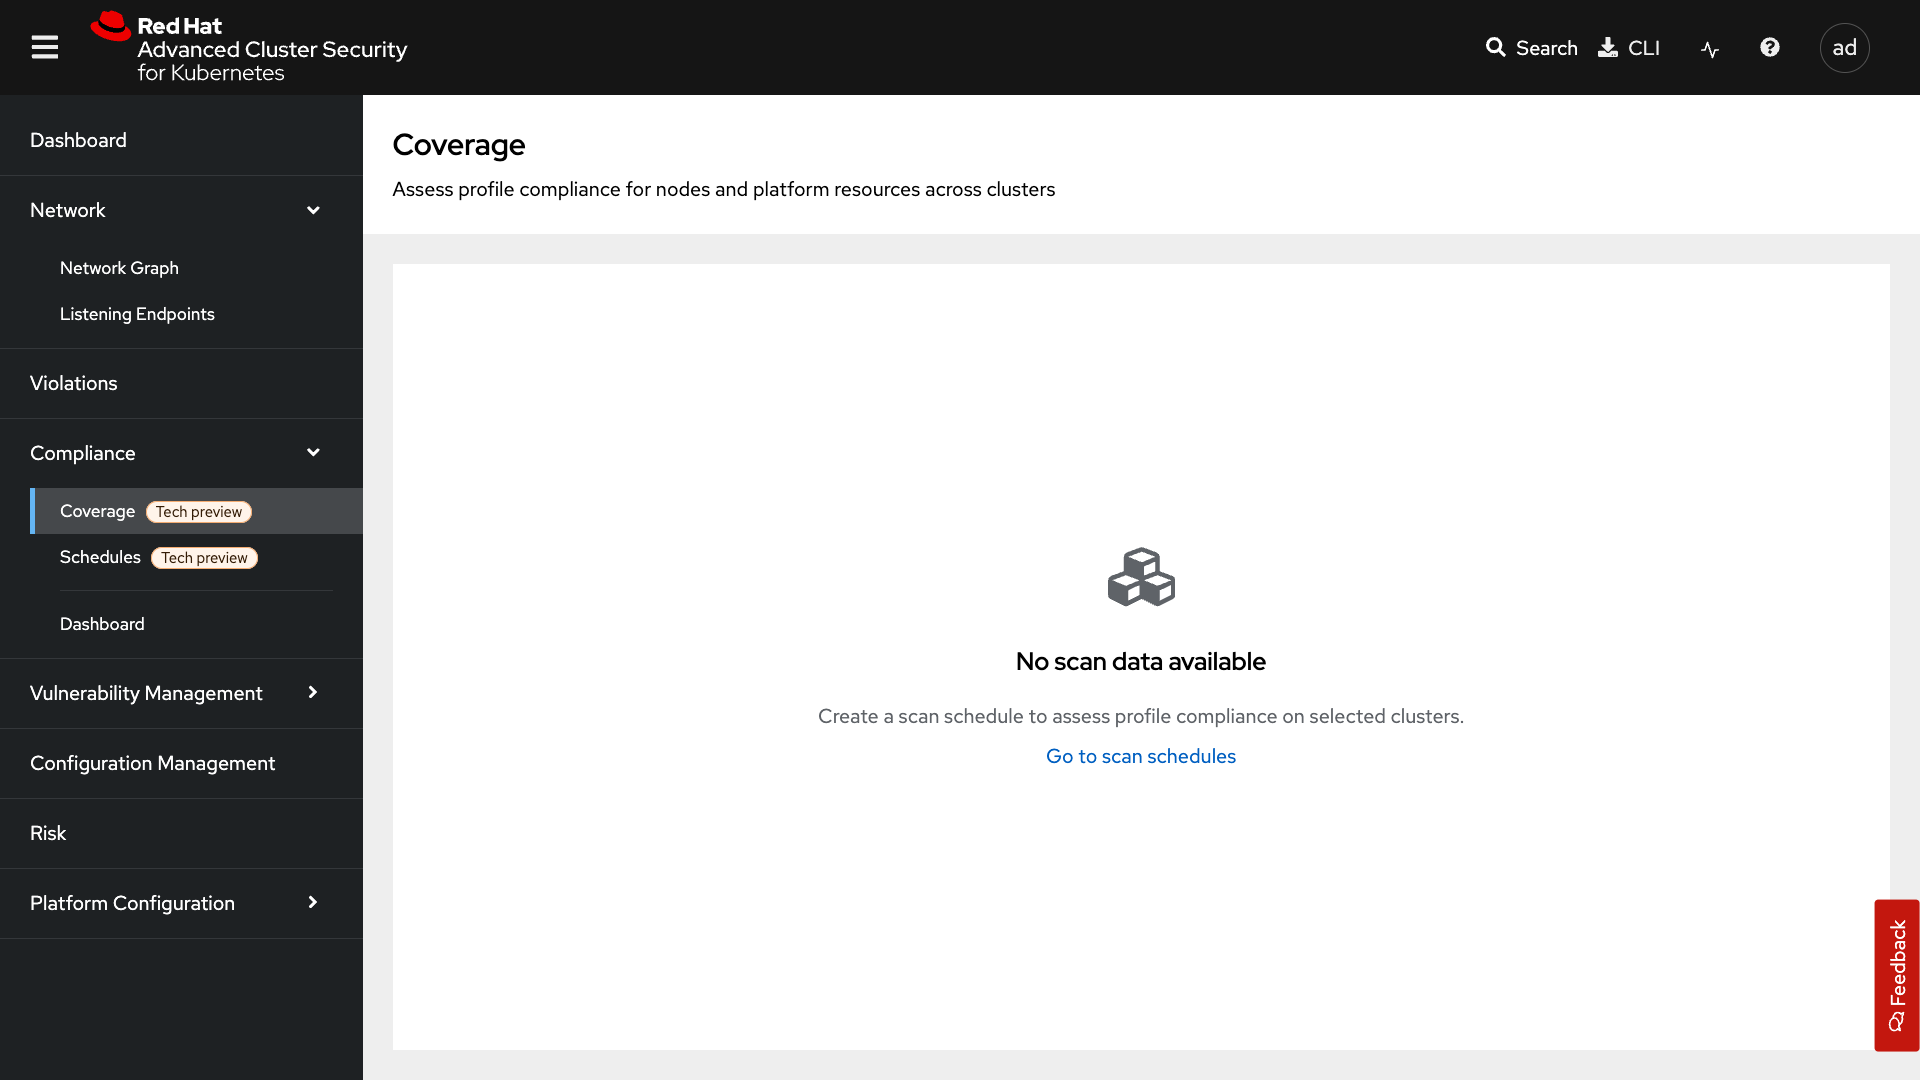
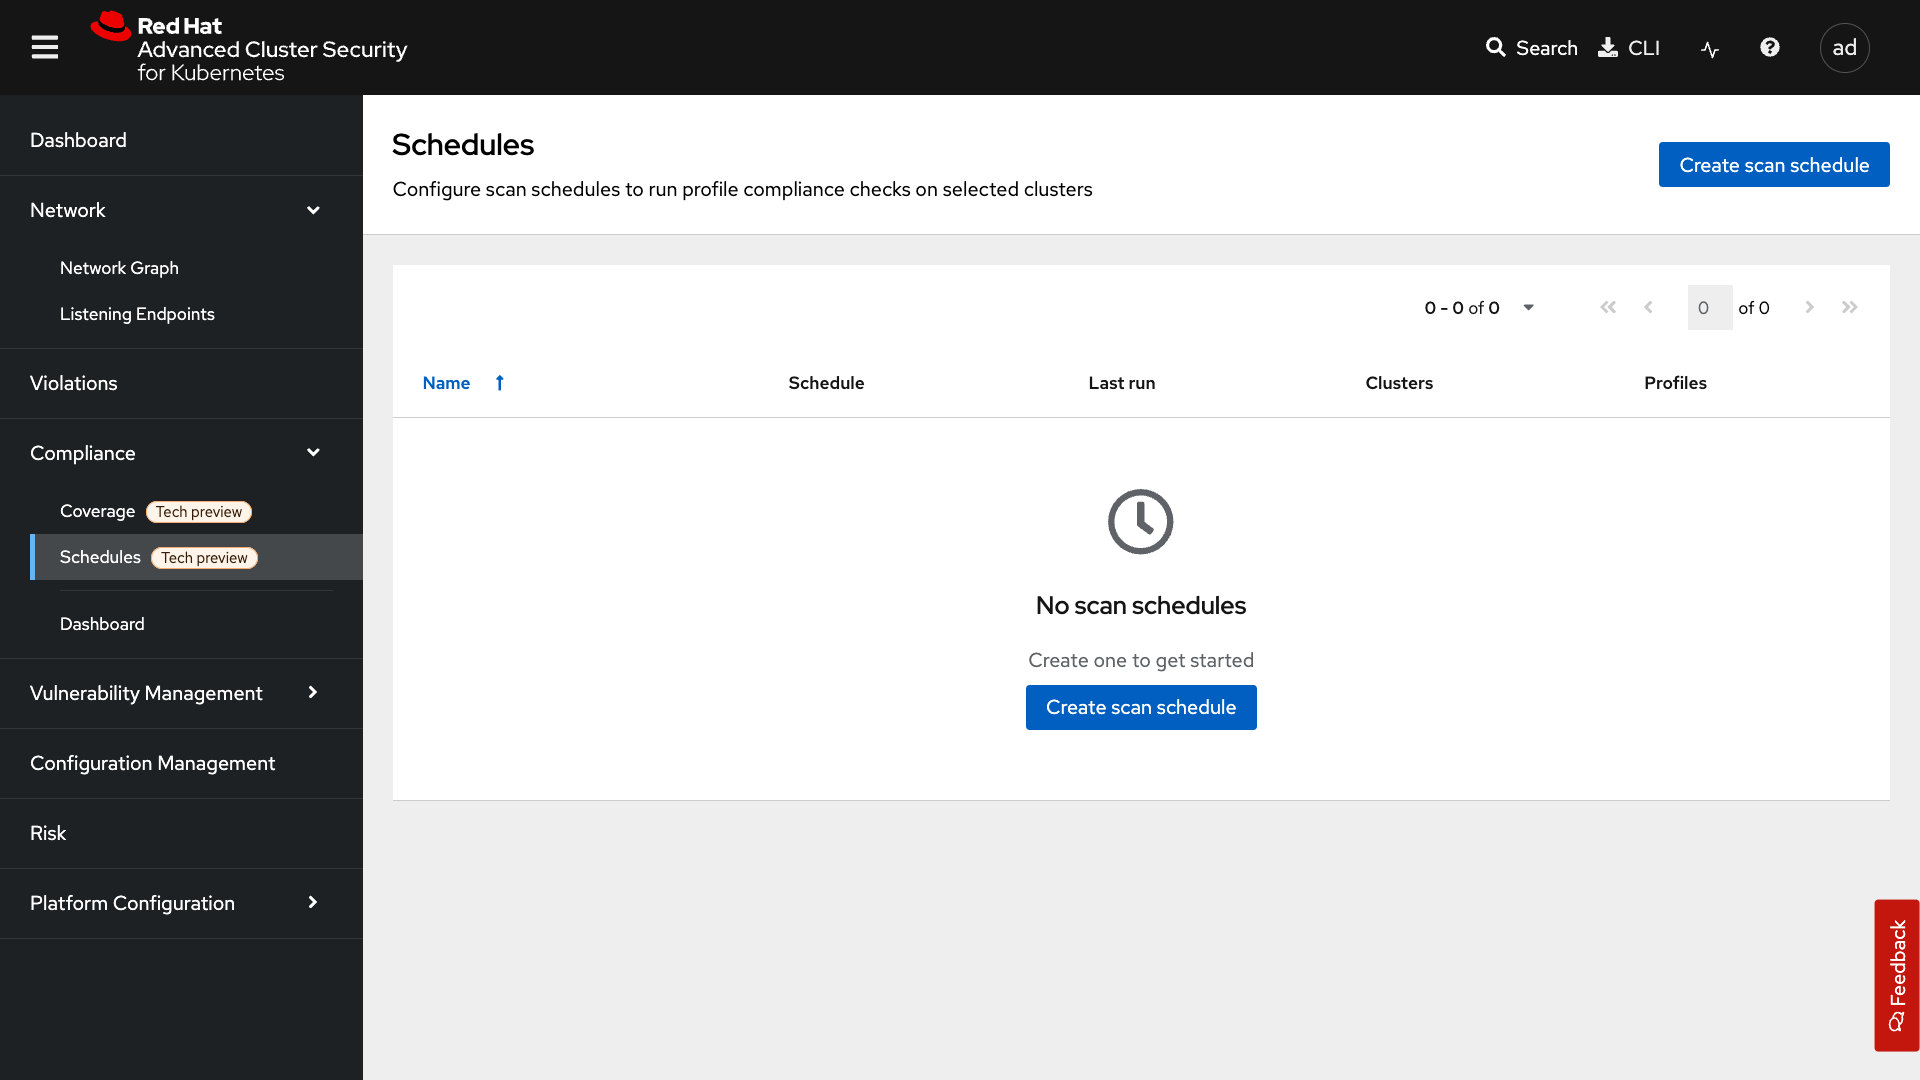
On first visit the dashboard may be empty until you run a scan. Click Scan environment in the top right to kick off your first scan.
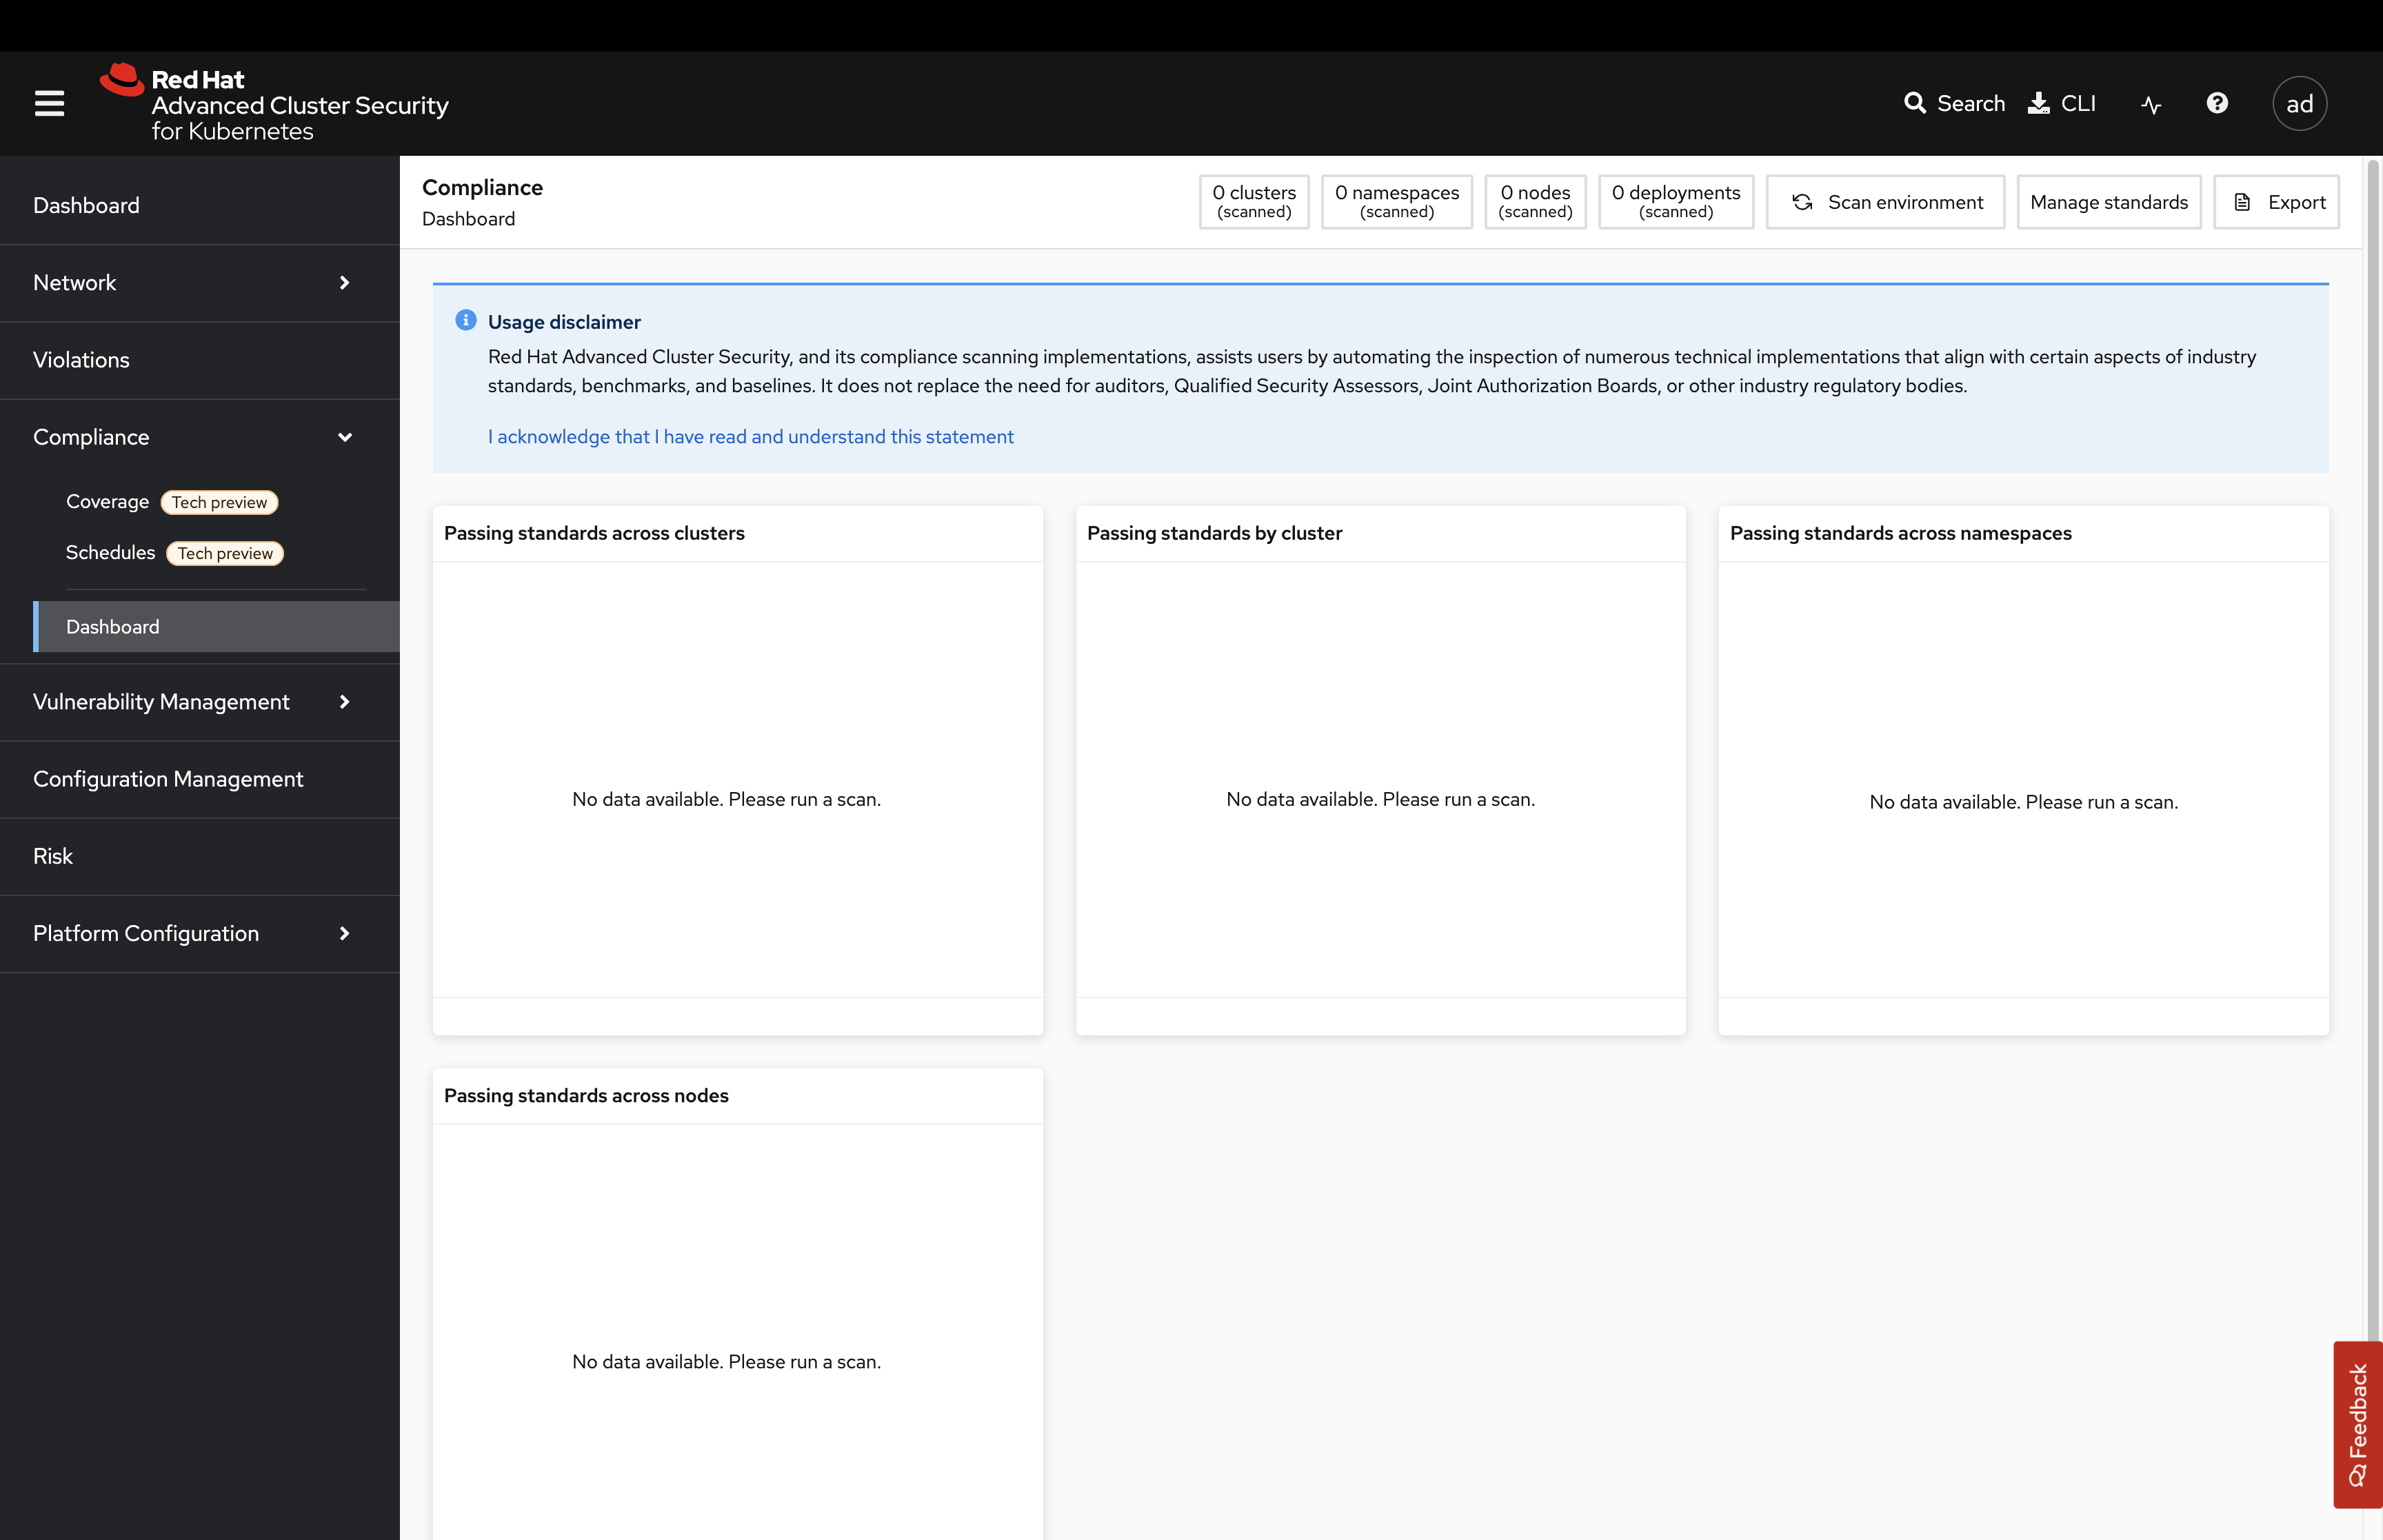
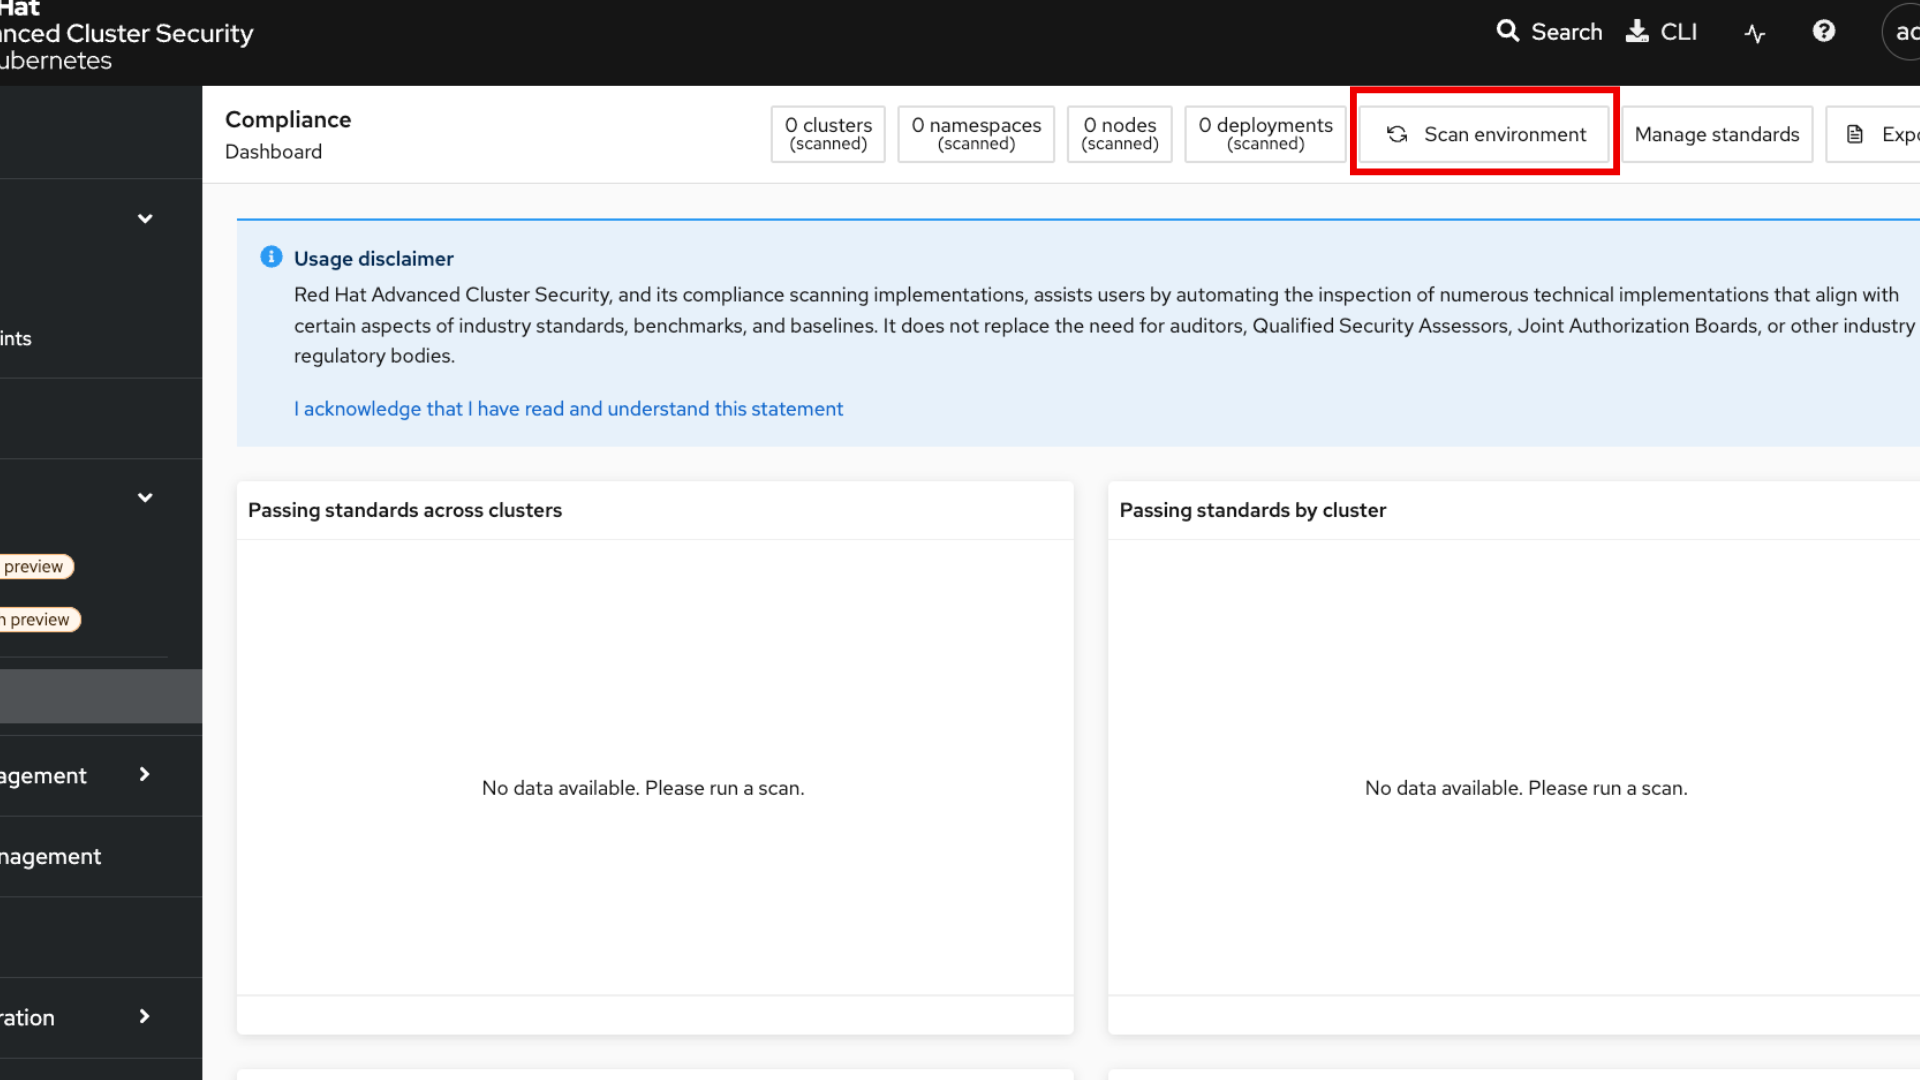
| Ensure the bar graphs fill with data before moving on. You will review these results in the Compliance module. |
4.4. Vulnerability Management
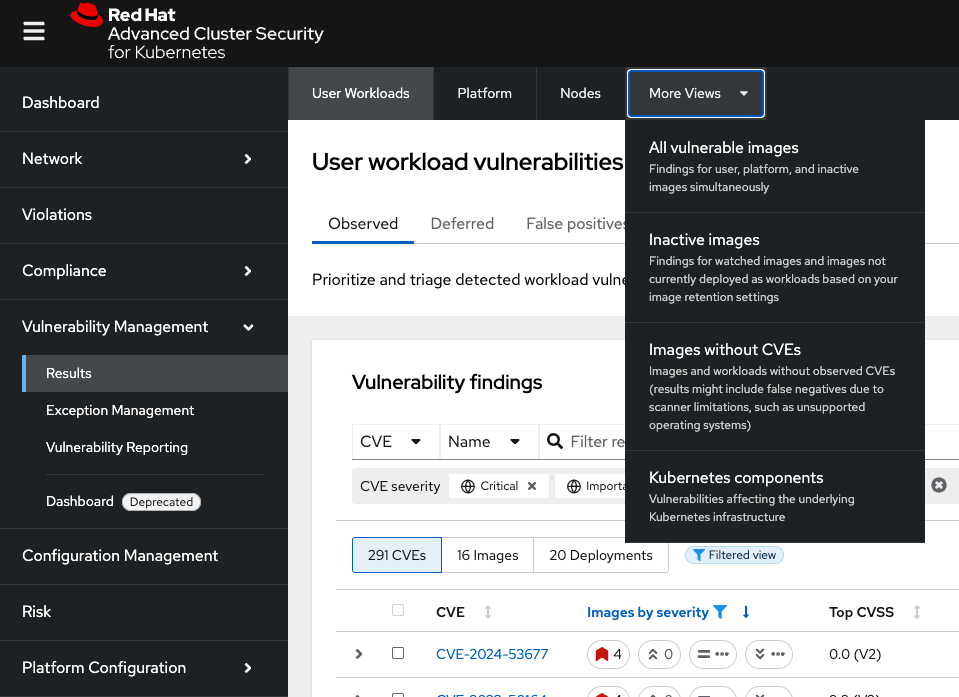
The Vulnerability Management tab separates workload, platform, and node CVEs. Key areas include Results, Exception Management, reporting, and platform/node CVE views.
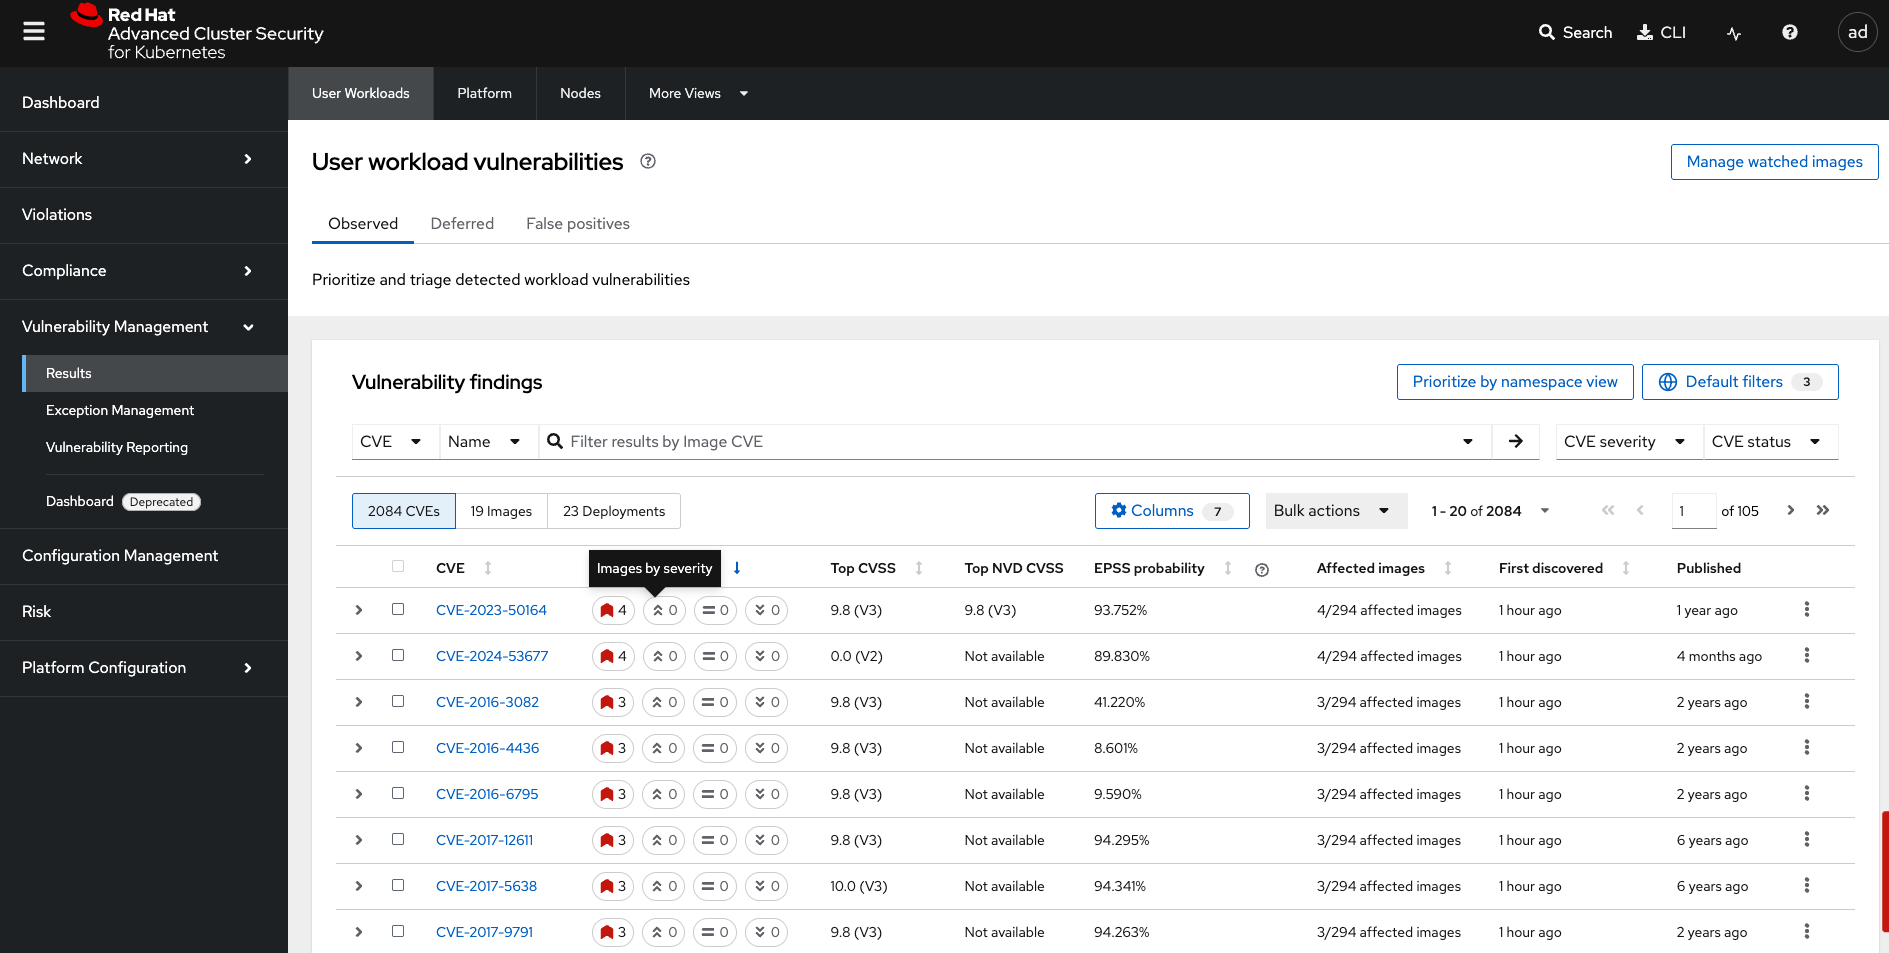
Click Results and explore the User Workloads, Platform, and Nodes tabs.
4.5. Configuration Management
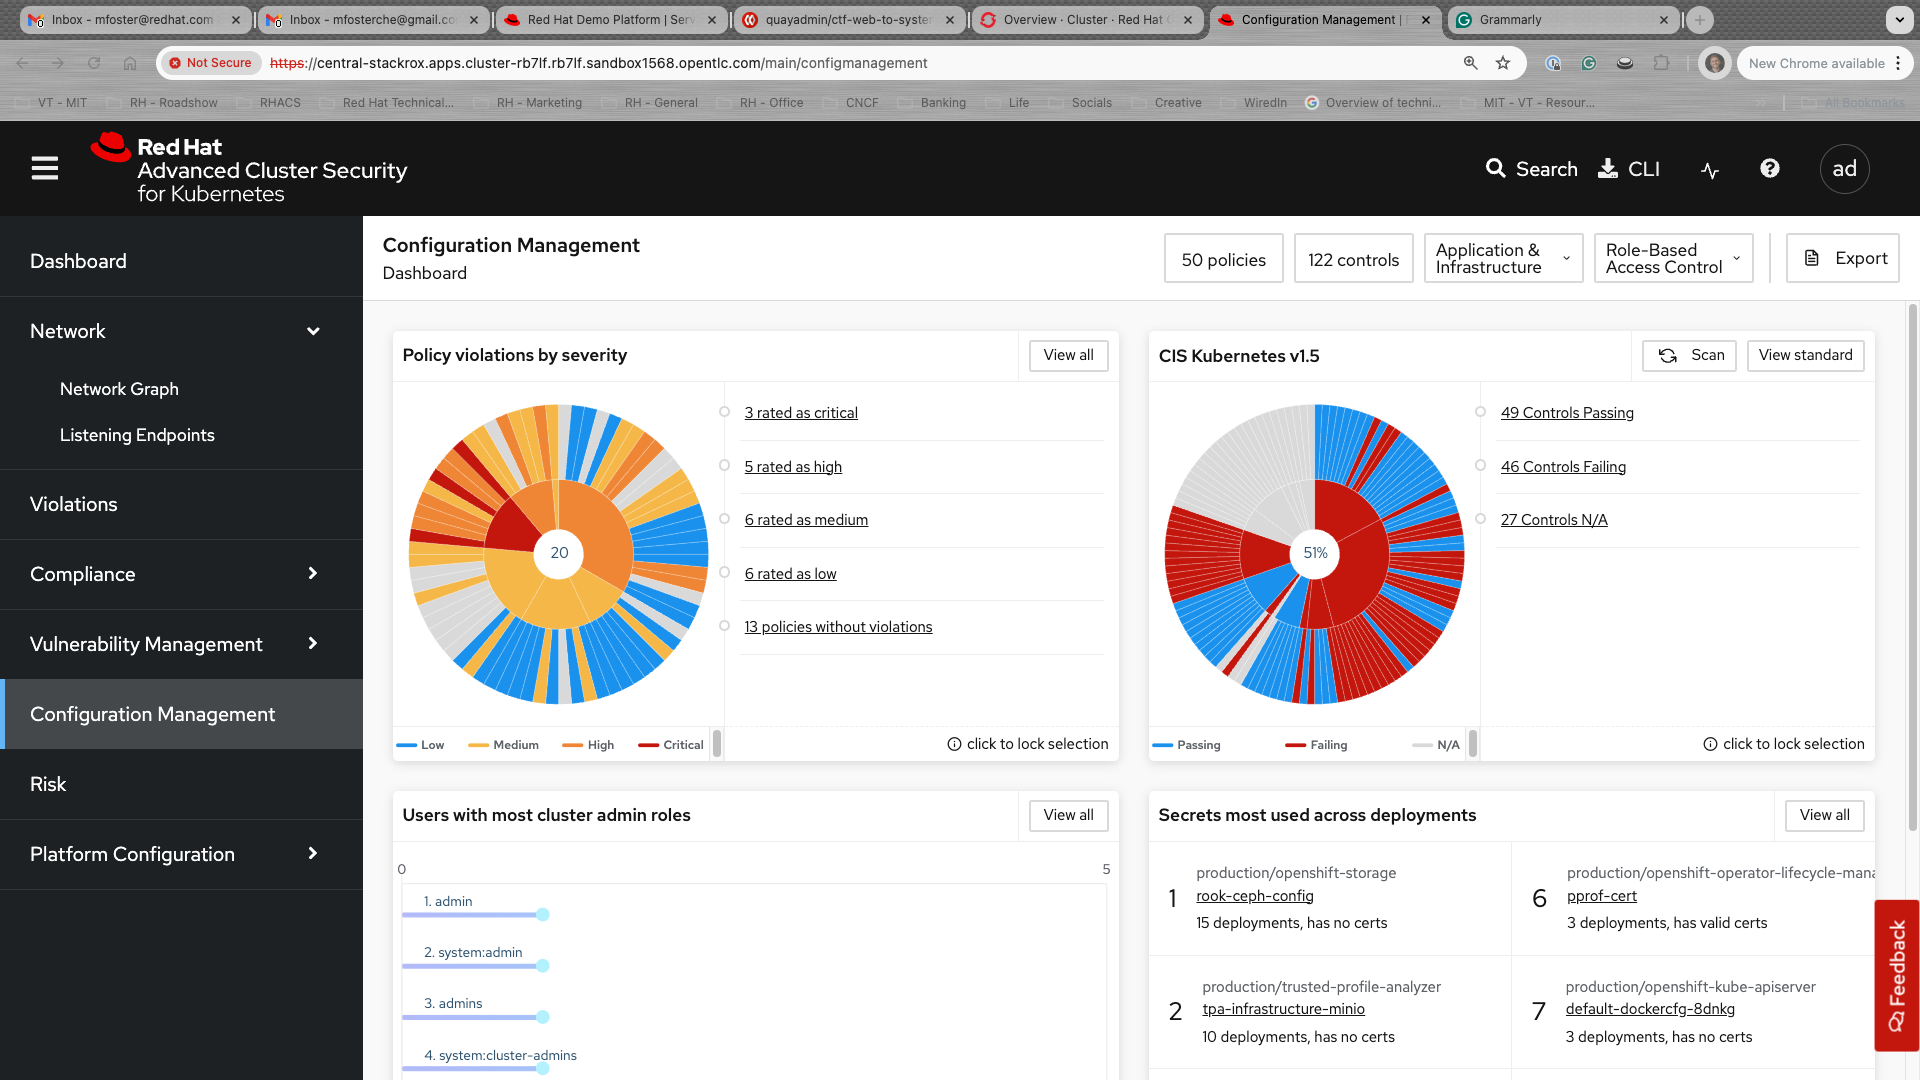
Configuration Management summarizes security posture across the cluster, including policy violations by severity, CIS Kubernetes benchmarks, privileged users, and secrets usage.
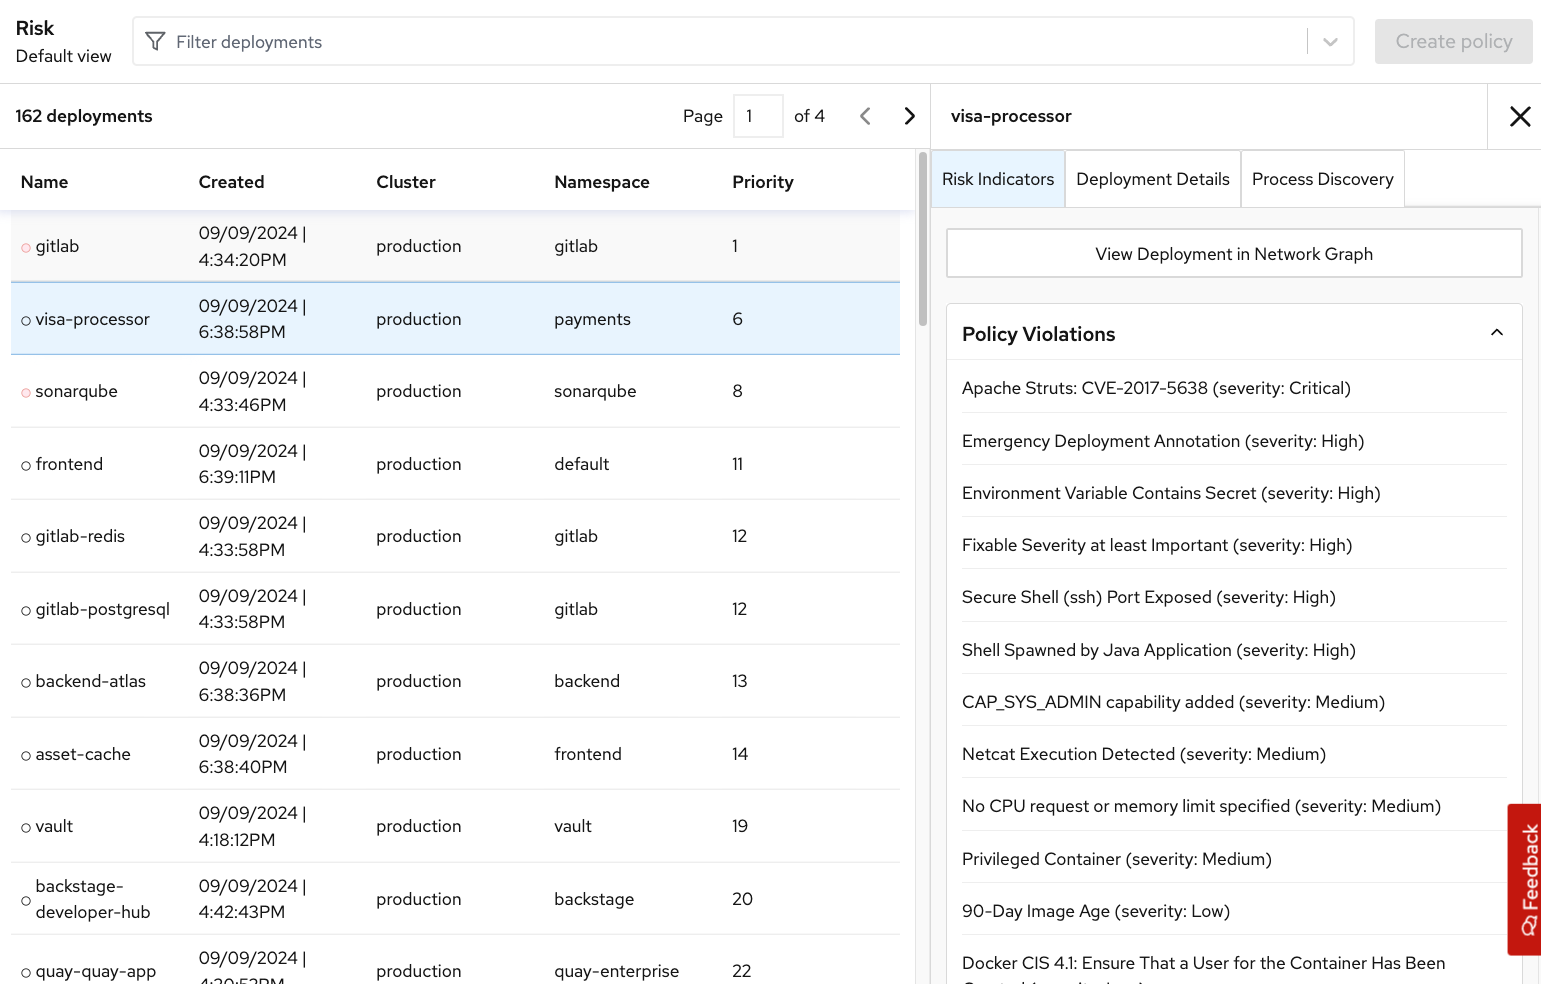
4.6. Risk
The Risk tab combines configuration, network, runtime, and vulnerability signals to prioritize workloads. Review risk indicators, deployment details, and process discovery data here.
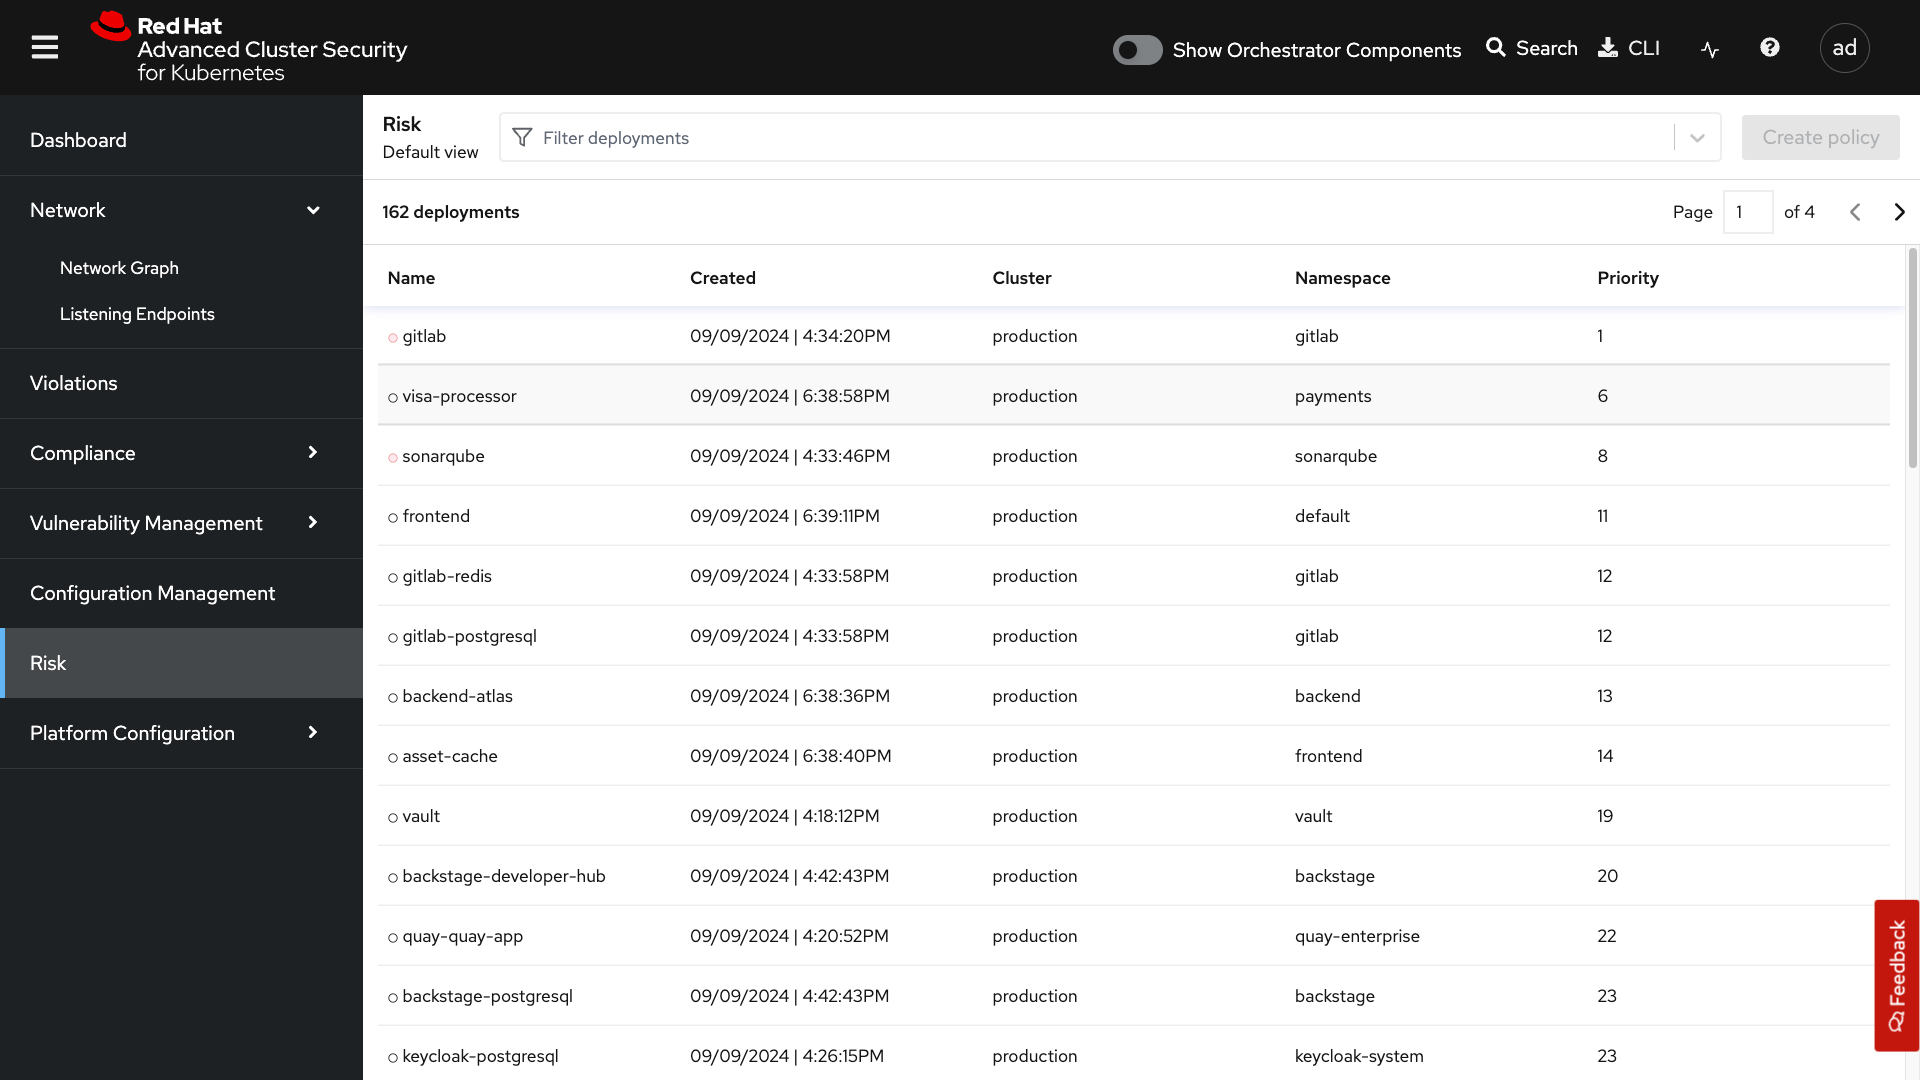
Use process discovery and deployment context to understand why a workload ranks higher than vulnerability count alone would suggest.
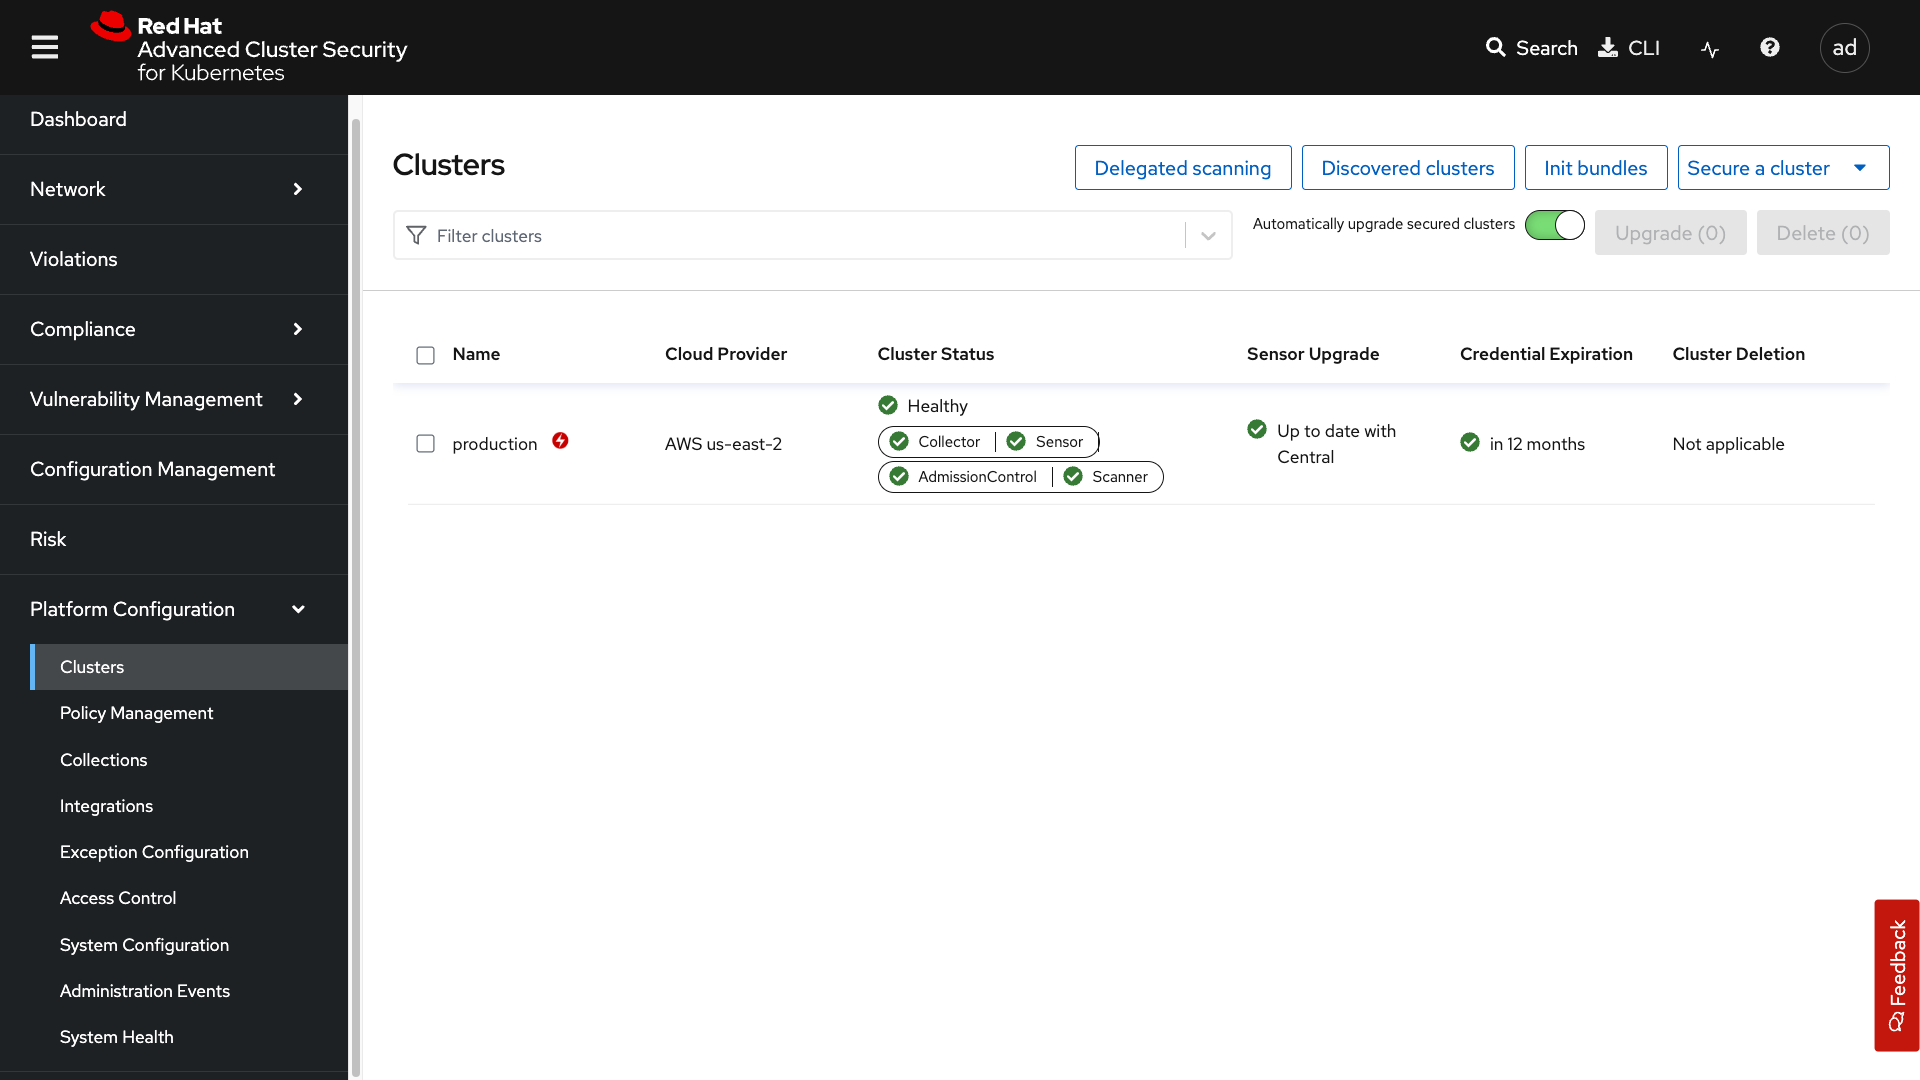
4.7. Platform Configuration
Platform Configuration is where you manage clusters, policies, collections, integrations, access control, and system health.
4.7.1. Policy Management
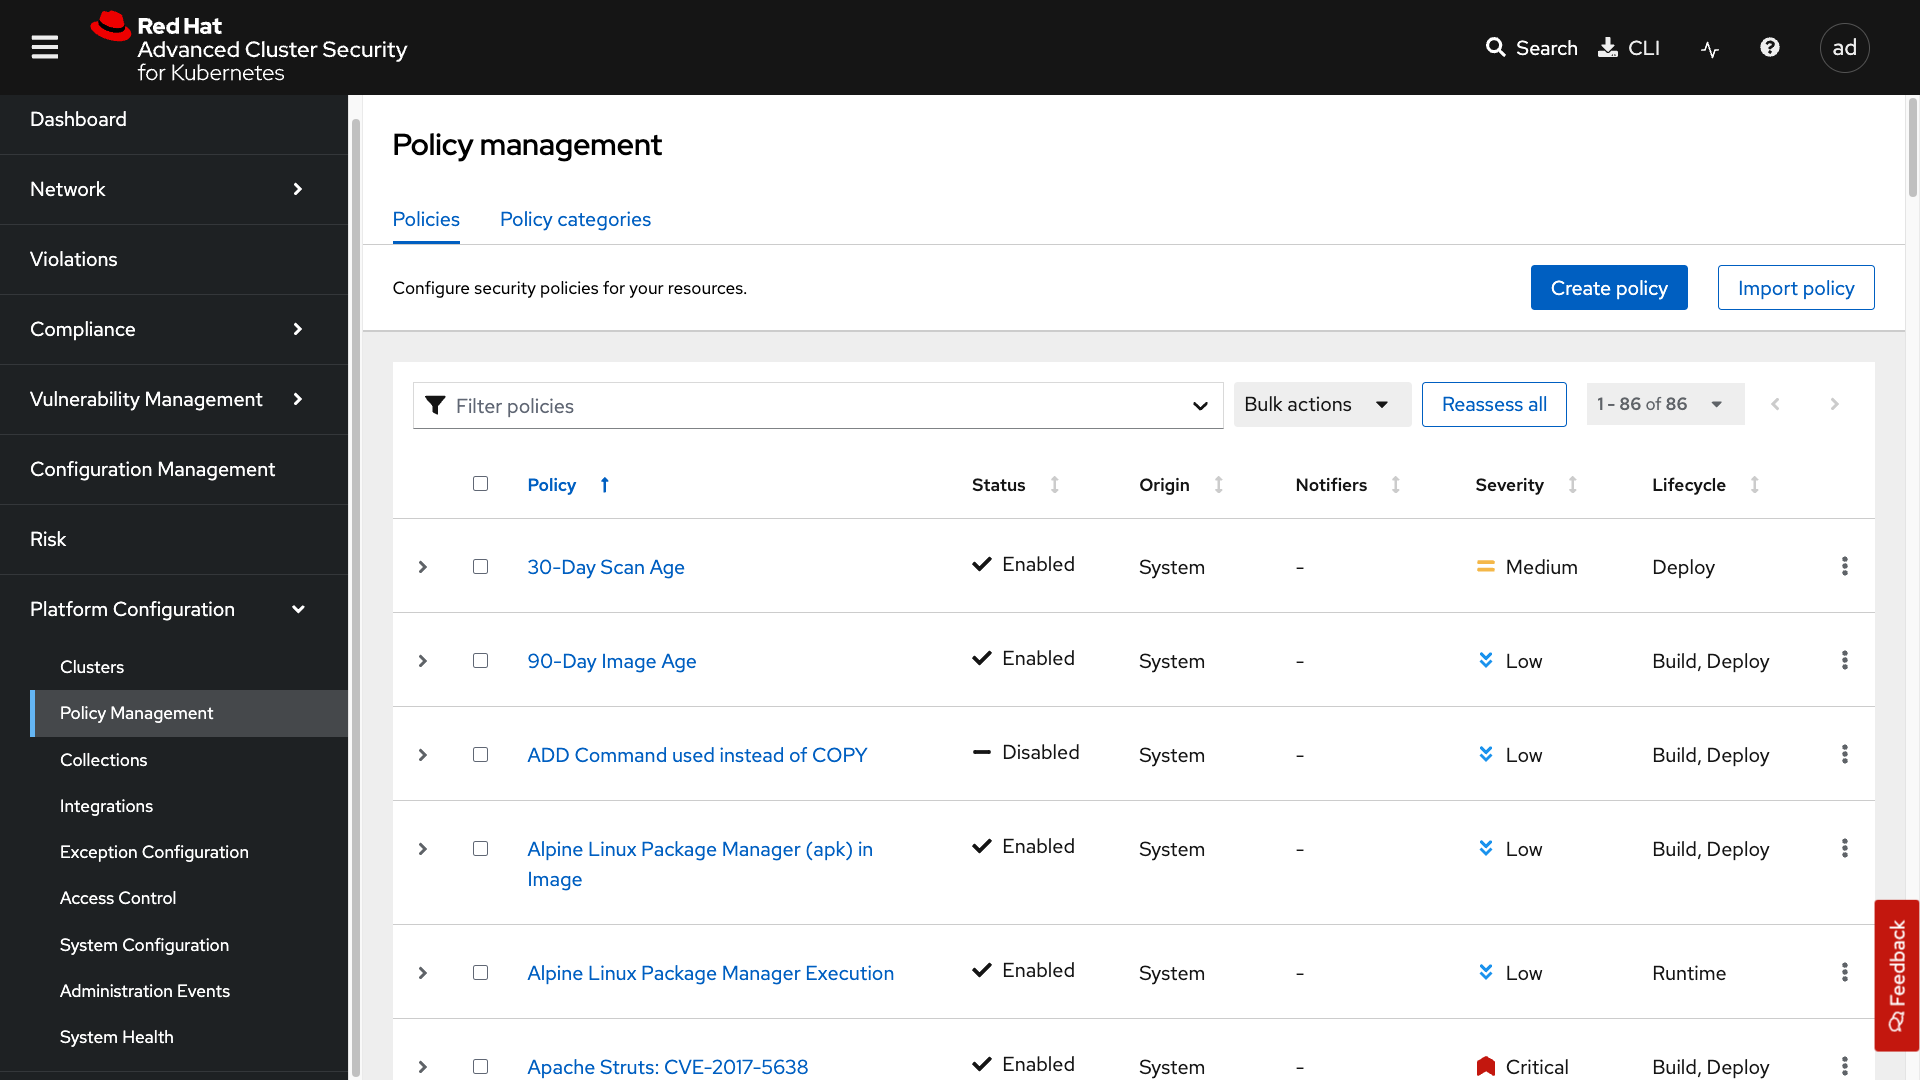
Clone, edit, and create policies. RHACS ships with many defaults; this is where you tailor enforcement for your environment.
4.7.2. Collections
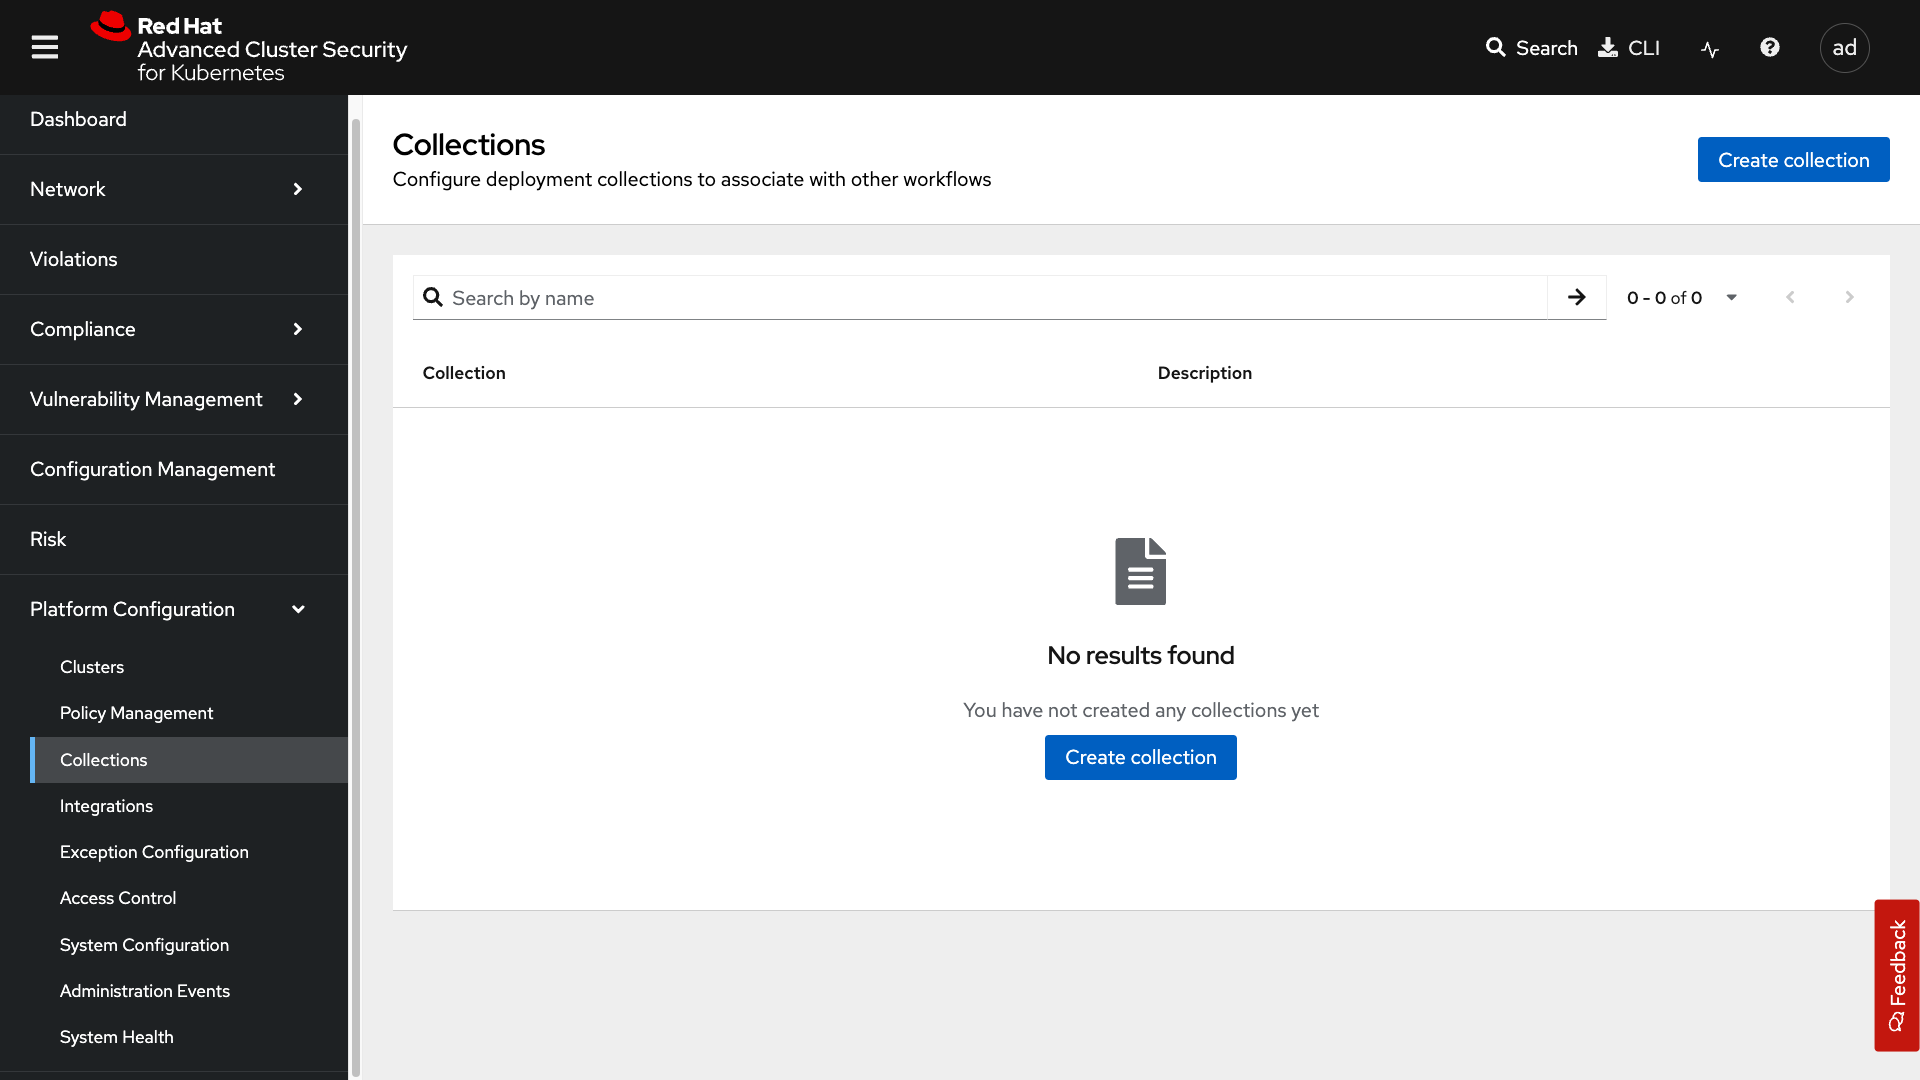
Group deployments into collections and attach policies, reporting, or compliance workflows to those groups.
4.7.3. Integrations
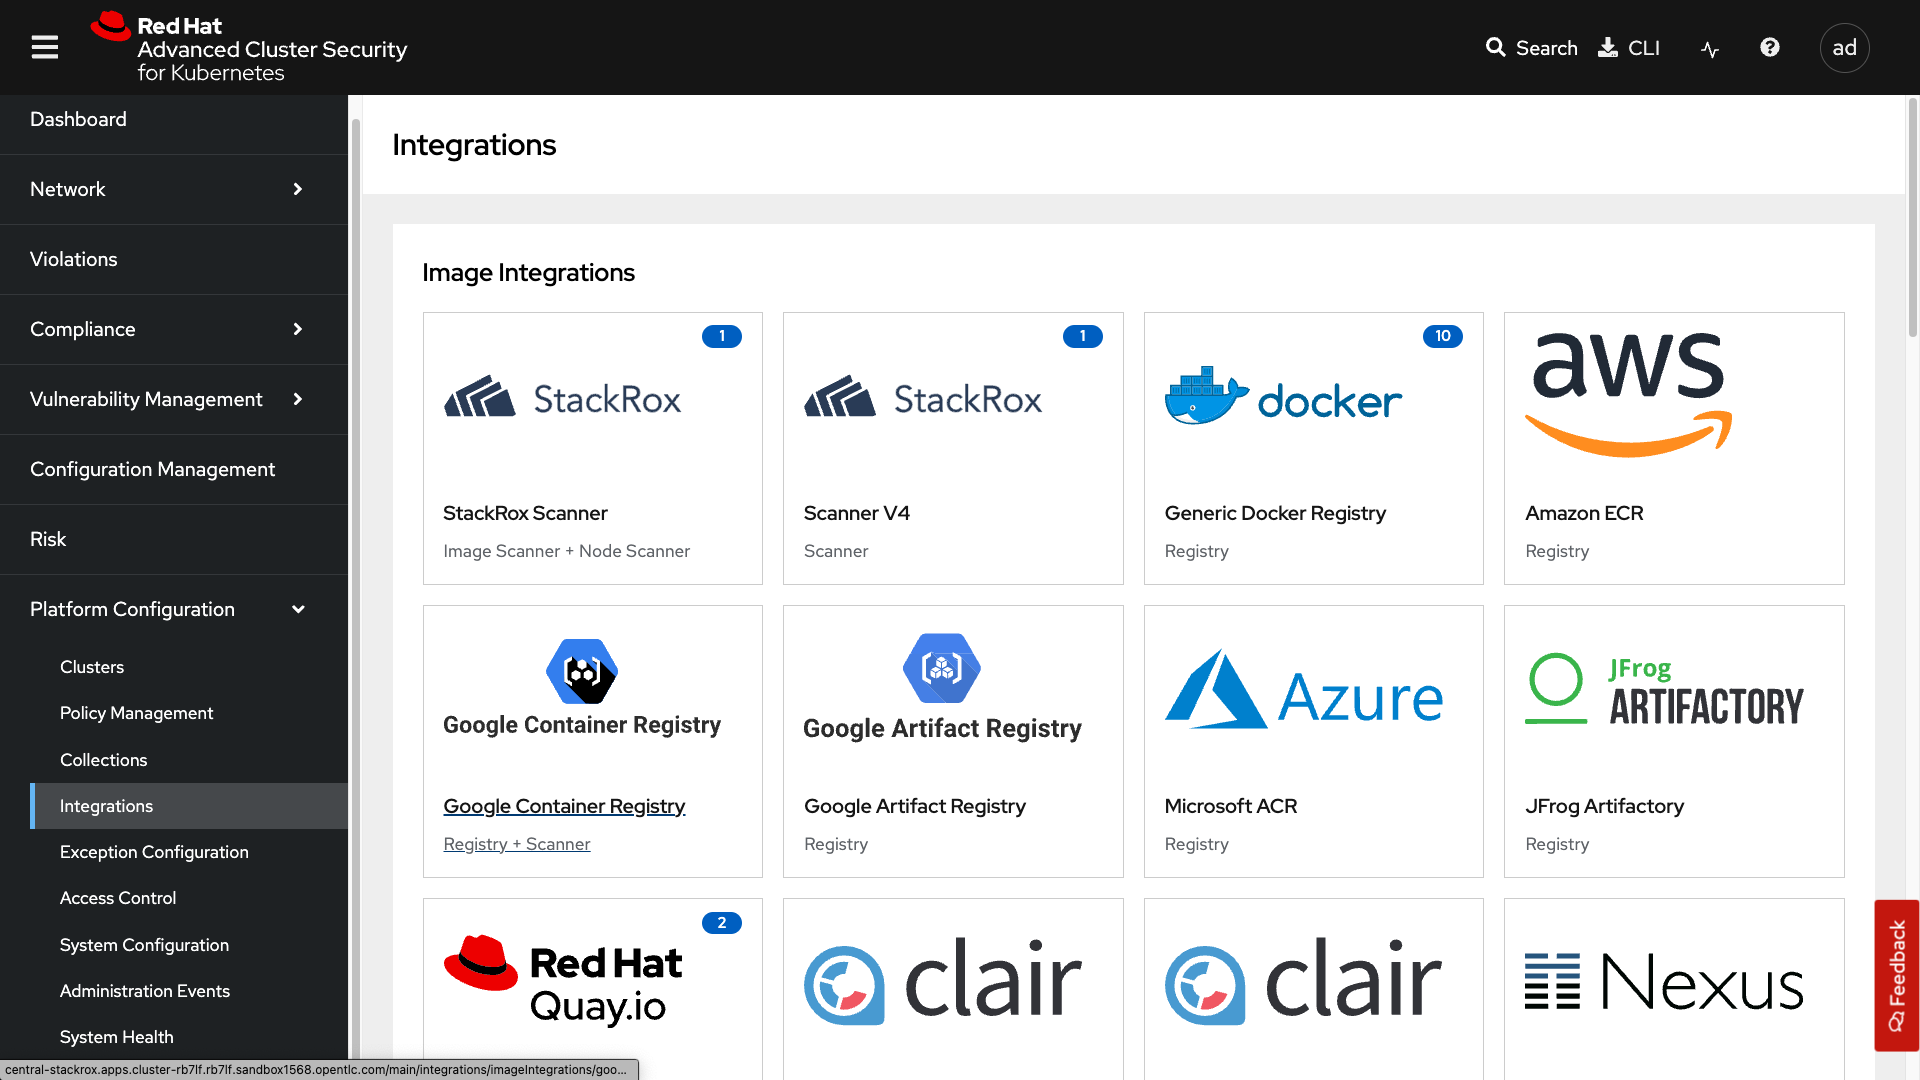
Connect image registries, notifiers, backup targets, cloud sources, and API tokens.
4.7.4. Access Control
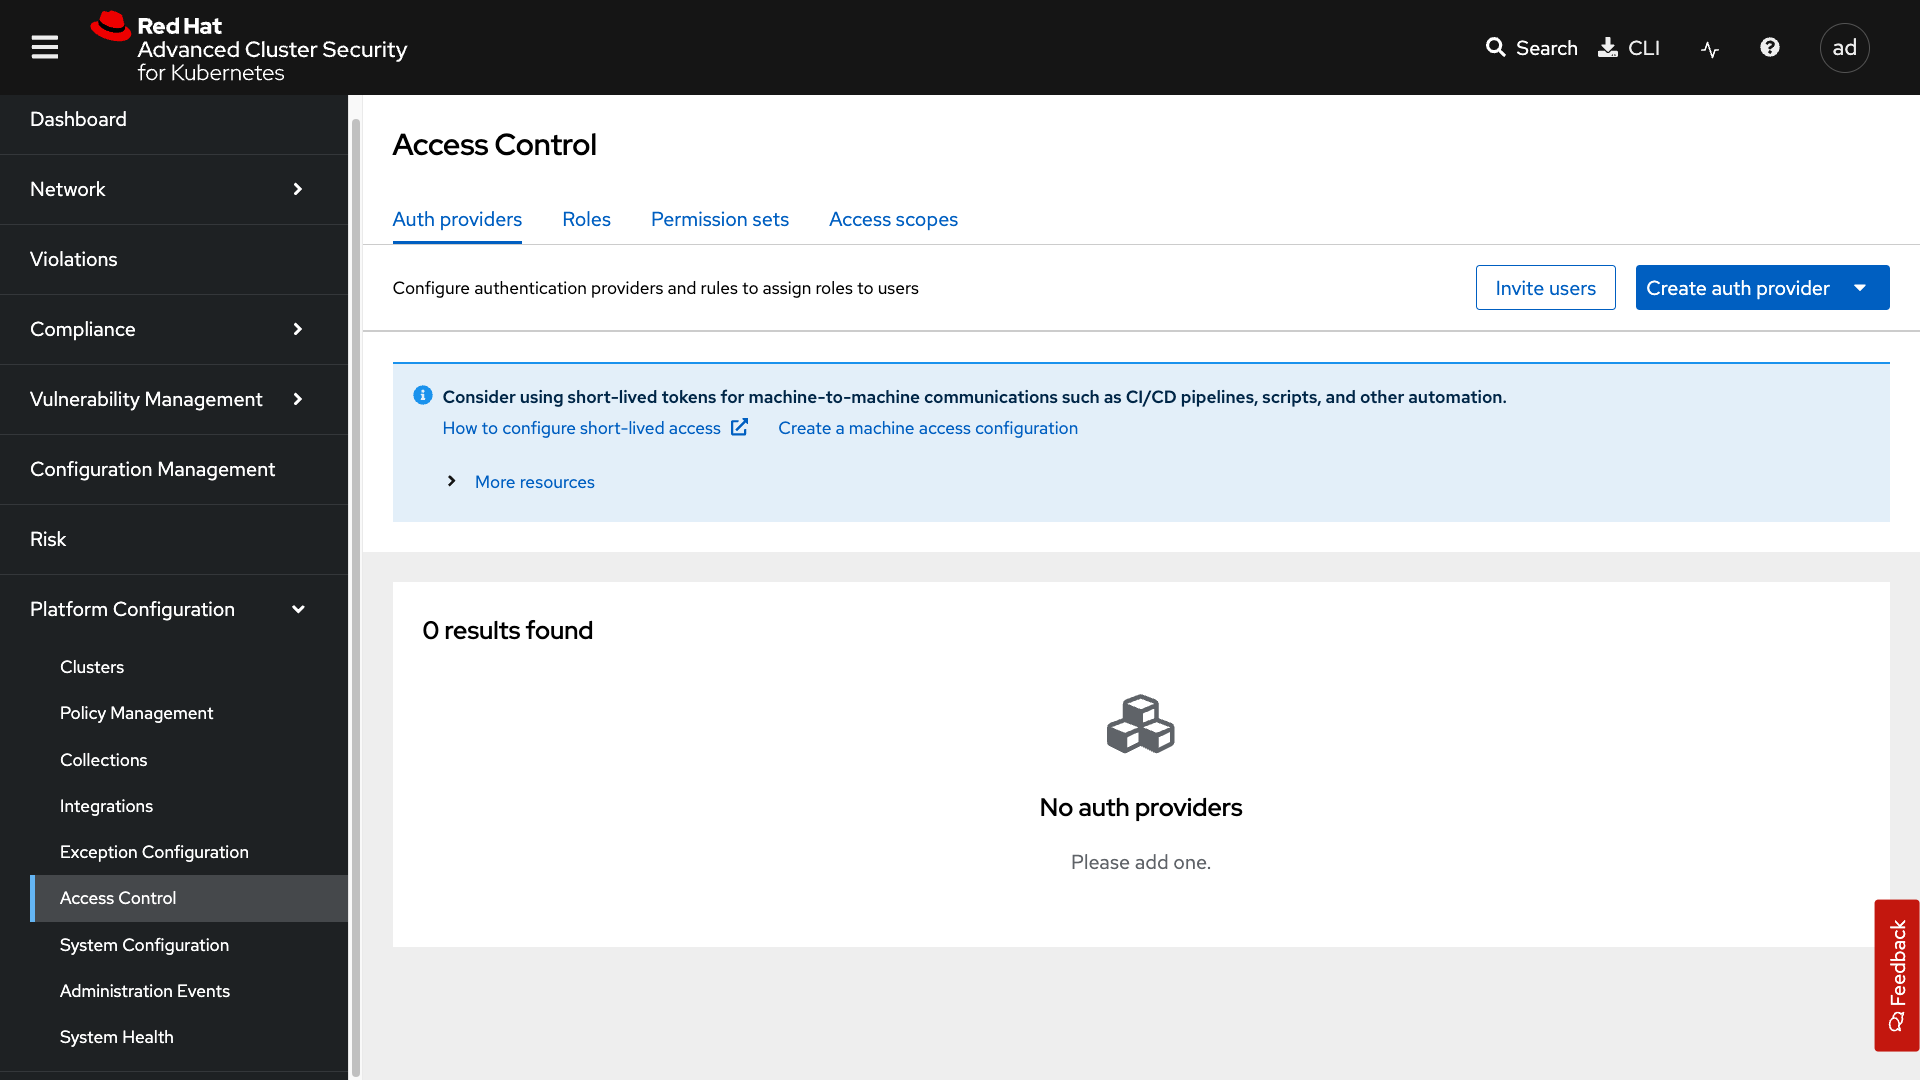
Configure authentication providers, roles, permission sets, and access scopes.
4.7.5. System Configuration and Health
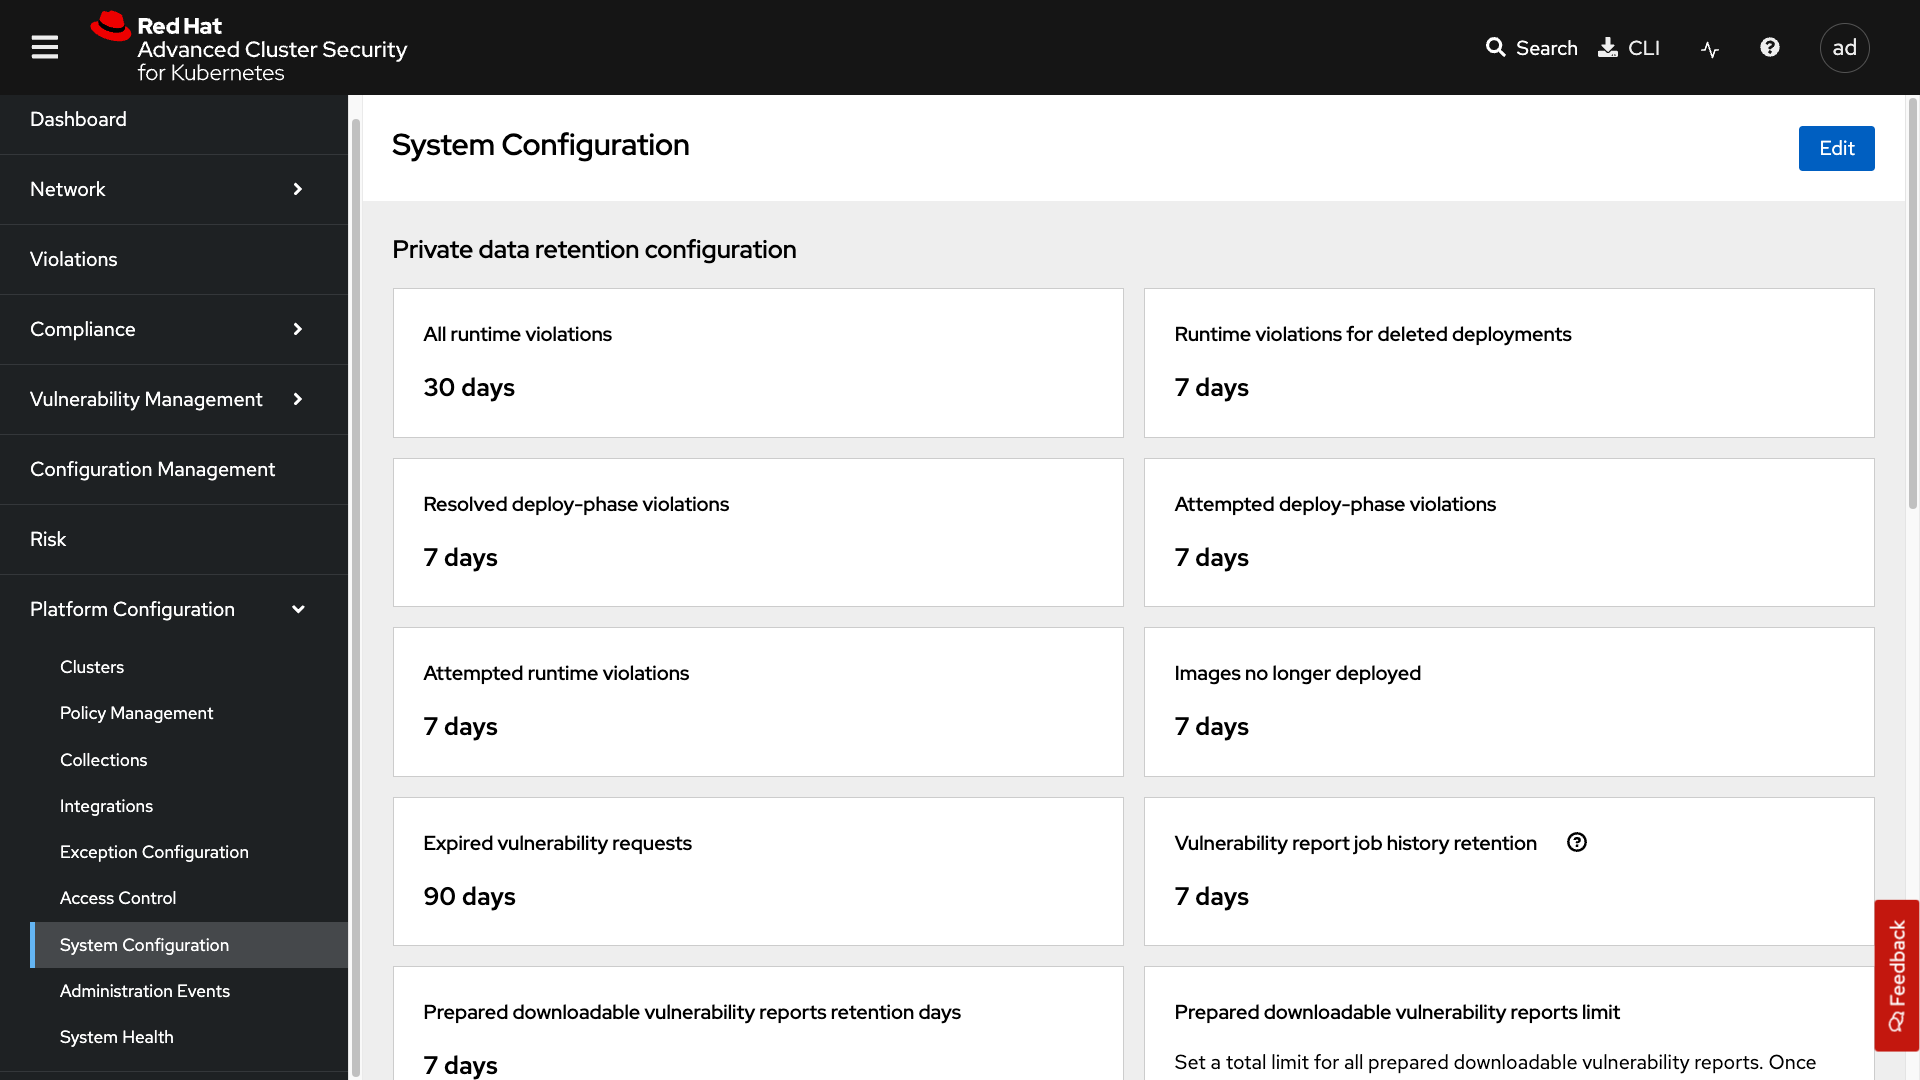
Manage data retention, cluster settings, and platform configuration.
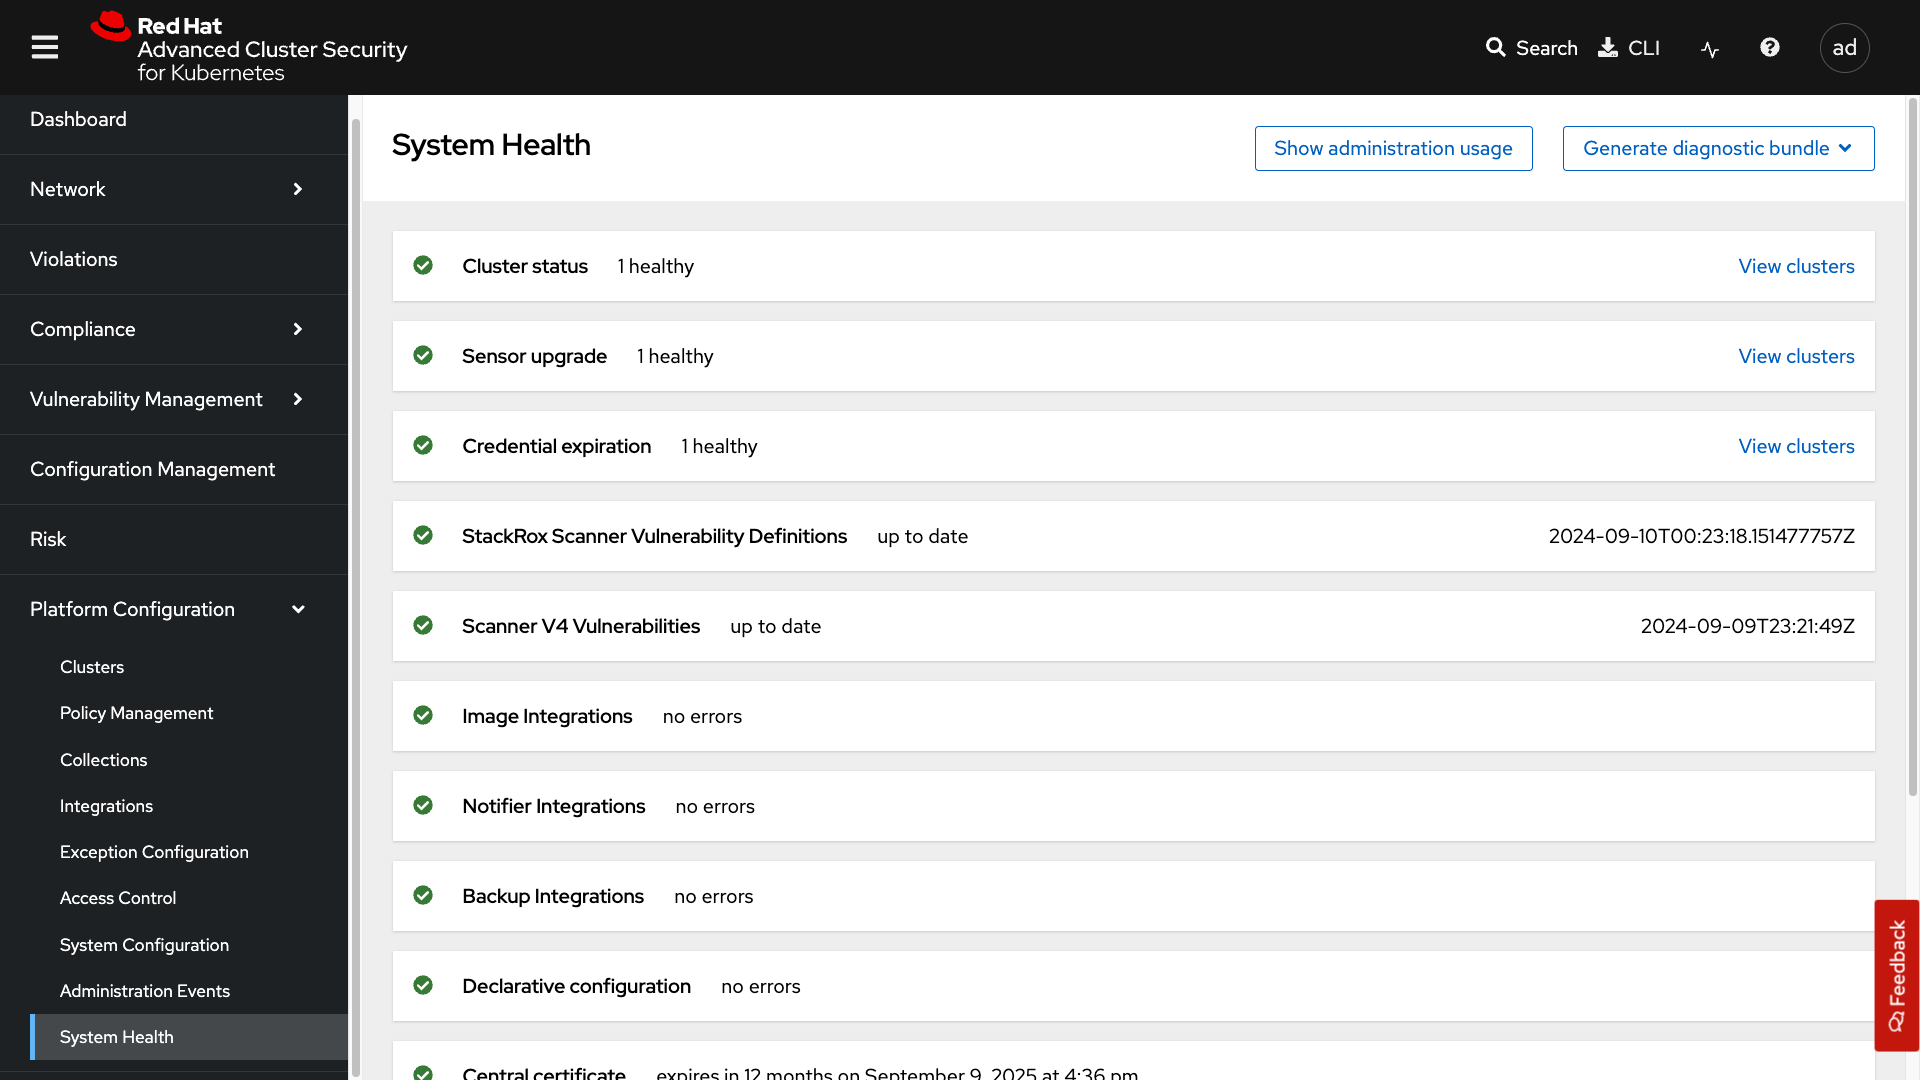
Monitor sensor upgrades, credential expiration, and generate diagnostic bundles from System Health.
Other Platform Configuration areas include Exception Configuration and Administration Events—useful for vulnerability exceptions and platform troubleshooting.
5. Security Exercise: ACME Incident Response
You are participating in the ACME Financial Services security incident workshop. Sarah, a senior OpenShift Platform Engineer, and Morgan from Infosec are responding to a breach in the payment-gateway production namespace. An attacker used a compromised CI/CD service account to exec into the payment-gateway pod, deploy a hidden toolkit (/tmp/.hidden_toolkit/exfil.sh), and beacon outbound to a command-and-control server.
Each ACS module ends with a hands-on exercise that advances this incident response story using RHACS and OpenShift platform tools.
5.1. Scenario
We have irregular egress traffic from payment-gateway on the production cluster. Sarah, use RHACS to locate the deployment and assess its risk before we touch the pod.
Infosec
5.2. Your task
The steps are there for guidance. If you need help, expand the step and compare your approach to the lab commands.
Step 1 — Open RHACS and switch to your namespace
Use your assigned workshop namespace suffix 1.
|
-
Payment gateway (breached workload):
payment-gateway-1 -
Vulnerable Socket.IO demo:
vulnerable-workload-1
Switch to your payment gateway namespace before running commands:
oc project payment-gateway-1If your administrator has not yet provisioned the environment, ask them to run ./setup/deploy-incident-env.sh from the roadshow repository (see setup/README.adoc).

-
Log in to the RHACS console at
{acs_route}[{acs_route}^].
Step 2 — Search for payment-gateway in Risk
-
Use Risk in the left navigation and search for
payment-gateway.
Step 3 — Open the deployment
-
Select the
payment-gatewaydeployment in namespacepayment-gateway-1.
Step 4 — Review risk factors
-
Review the risk factors: external exposure, suspicious processes, and configuration issues.
Use global search with the query:
Deployment:payment-gateway Namespace:payment-gateway-{workshop_user_suffix}5.3. What you learned
-
RHACS Risk view consolidates vulnerability, configuration, and runtime signals for a compromised deployment.
-
Locating a workload quickly is the first step when responding to an active incident.
-
The payment gateway shows elevated risk due to external connectivity and anomalous runtime behavior.