Network and Runtime Security
1. Module Goals
-
Review the Network Graph and listening endpoints
-
Create Network Policies that improve CIS compliance
-
Enforce a runtime policy that kills a pod when a package manager runs
-
Know where deeper ACS runtime hunting lives (301-04)
2. Understanding the Network UI
The Network UI is broken into two tabs: the Network Graph & the Listening Endpoints tab.
2.1. The Network Graph
The Network Graph in RHACS provides a visual representation of the network traffic and relationships between different components within a Kubernetes cluster. This feature is crucial for understanding and managing the network security of Kubernetes clusters, as endpoint detection is not enough with containers. In Kubernetes and OpenShift, you need visibility on exposed services.
RHACS Network Graph helps you visualize network traffic by displaying the flow of network traffic between different pods, services, and namespaces within a Kubernetes cluster. The Network Graph also helps identify unusual or unexpected network traffic patterns. If there are unexpected connections or traffic flows between components that should not be communicating, these anomalies can be quickly spotted and investigated. By understanding the actual network traffic, security teams can create more precise network policies to restrict unnecessary communication paths and reduce the attack surface. The Network Policies can be generated at deploy-time or runtime.
2.2. The Exposed Ports Dashboard
The Exposed Ports Dashboard gives users a clear and organized view of all the services in their Kubernetes cluster that are exposed to external networks.
2.3. BONUS: The roxctl netpol CLI Command
The roxctl netpol command in Red Hat Advanced Cluster Security (RHACS) for Kubernetes offers several advantages that enhance network security management within Kubernetes environments. This command is part of the roxctl CLI tool, which is designed to interact with RHACS. The roxctl netpol command can automatically generate Kubernetes network policies based on the OpenShift and Kubernetes assets. This can be done in deploy-time by developers OR operators to help accelerate network policy adoption.
3. Runtime policy enforcement
RHACS monitors container processes and collects data to help create policies that block unwanted behavior. Runtime policies can include criteria from build-time and deploy-time but also account for process executions. For the Runtime stage, RHACS stops pods that match the policy; it does not scale the deployment down to zero.
This is the first step in shifting left: after you block apk at runtime, you prevent the package manager from existing in the image (02 deploy-time, 03 build-time).
3.1. Prevent execution of the package manager binary
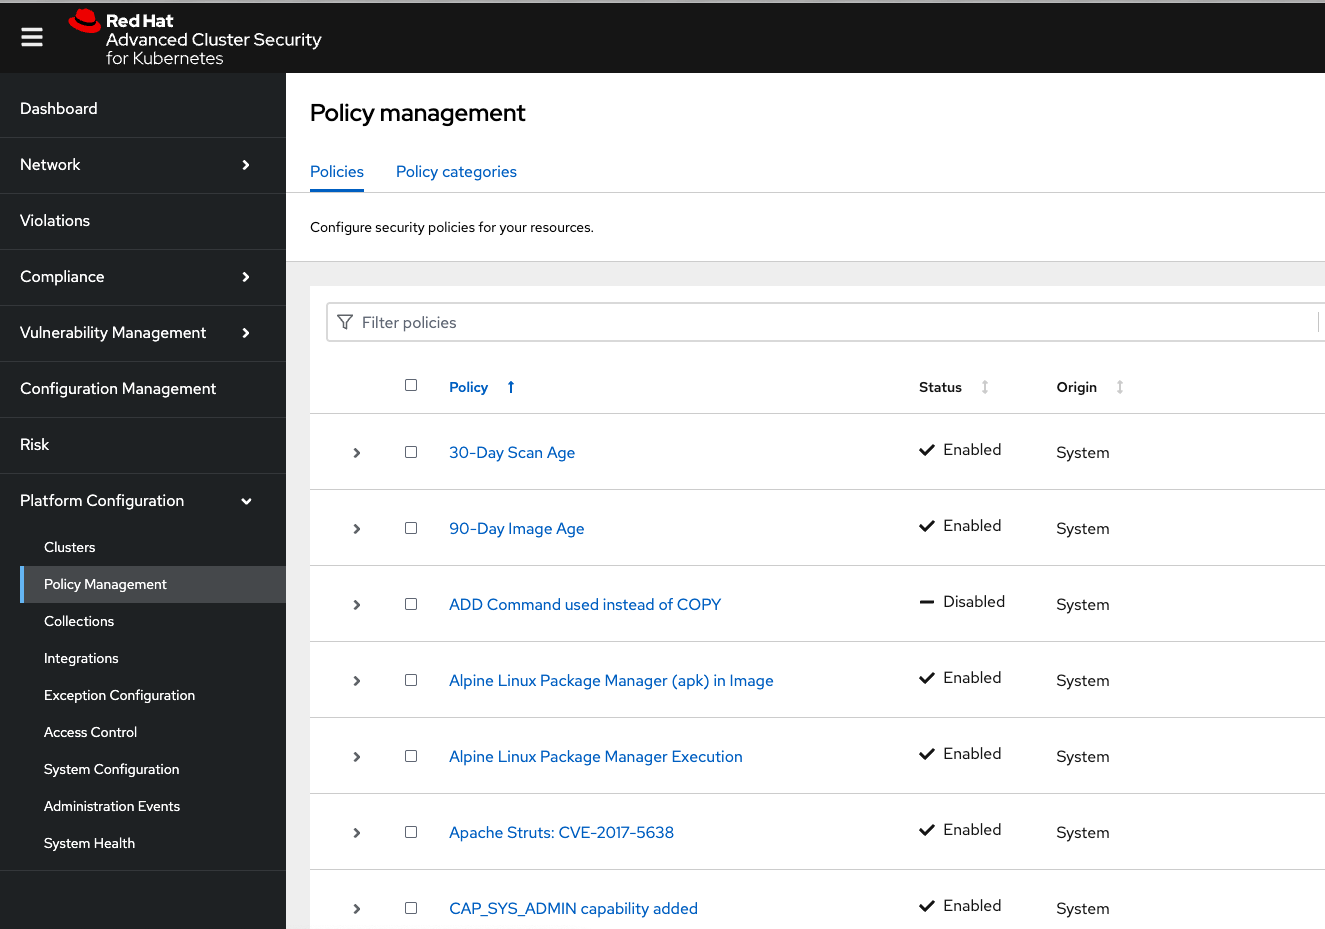
Procedure . On the left-hand side of the application, click the Platform Configuration tab and select Policy Management:
-
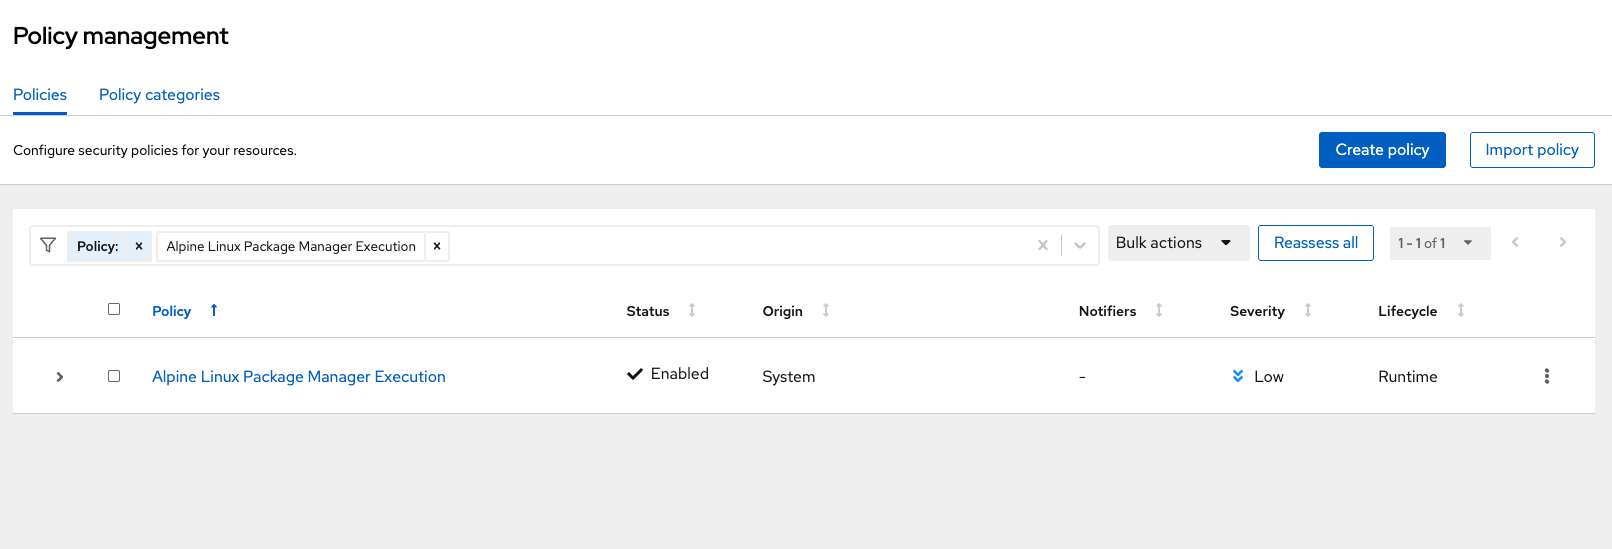
Filter through the policies to find Alpine Linux Package Manager Execution or use the search bar to select Policy:
-
Once you have found the policy Alpine Linux Package Manager Execution, click on it to learn more:
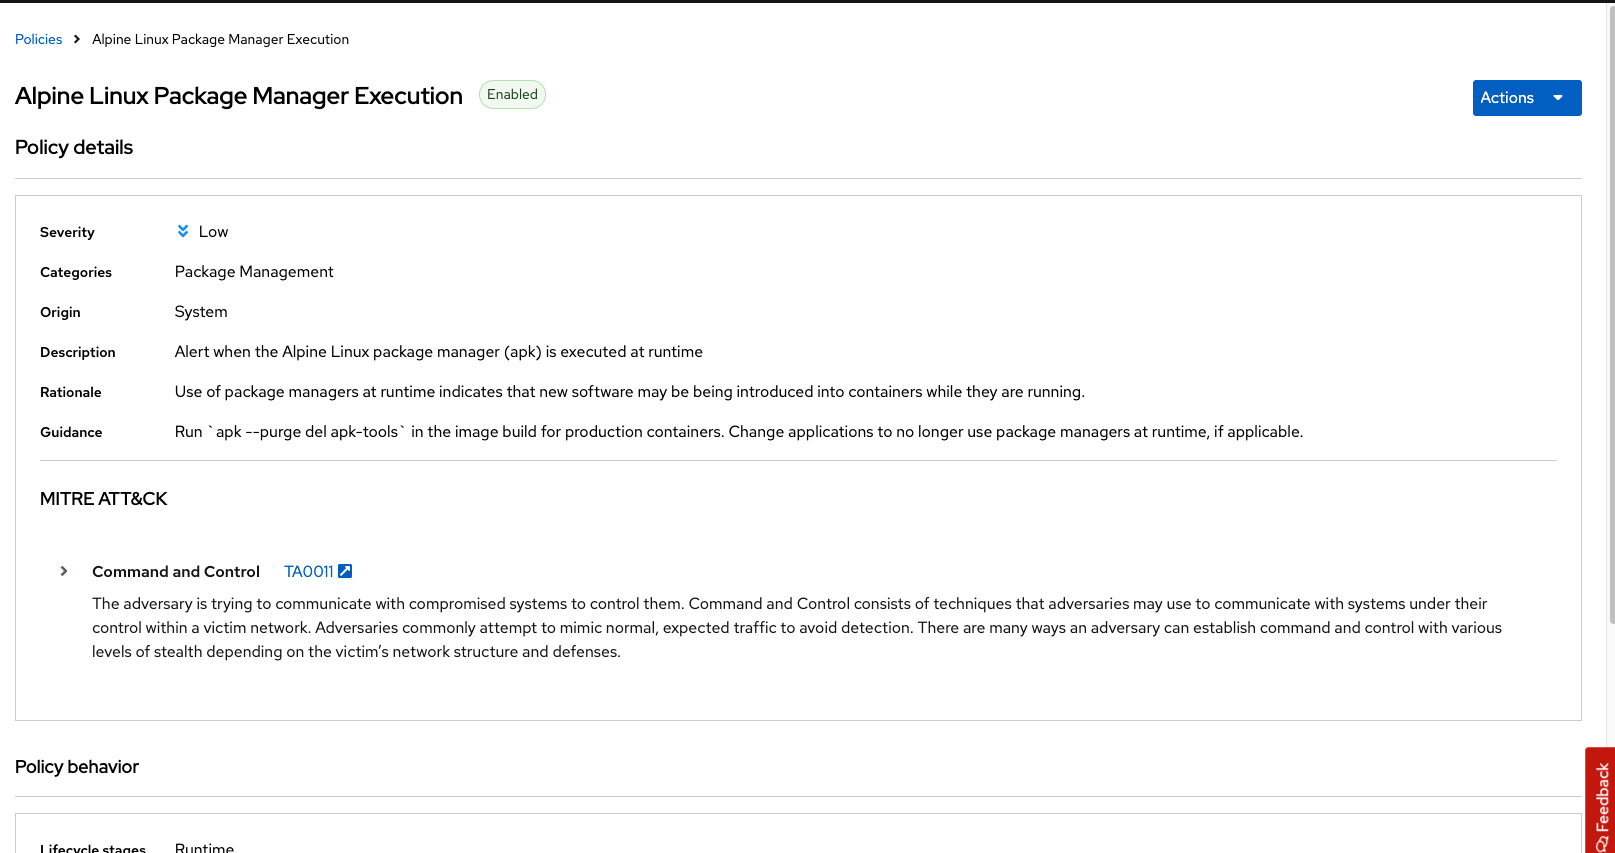
Package managers like apt, apk, and yum/dnf belong on hosts, not in running containers. Enforcing this policy through OpenShift (kill the pod) keeps cluster state consistent.
3.2. Enable enforcement of the policy
Procedure
-
Click the Actions button, then click CLONE policy. Then give it the name "Alpine Linux Package Manager Execution - Runtime":
Alpine Linux Package Manager Execution - Runtime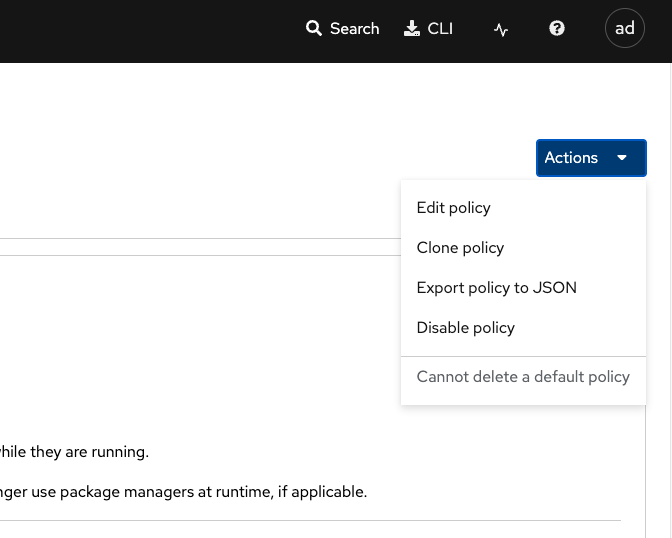
-
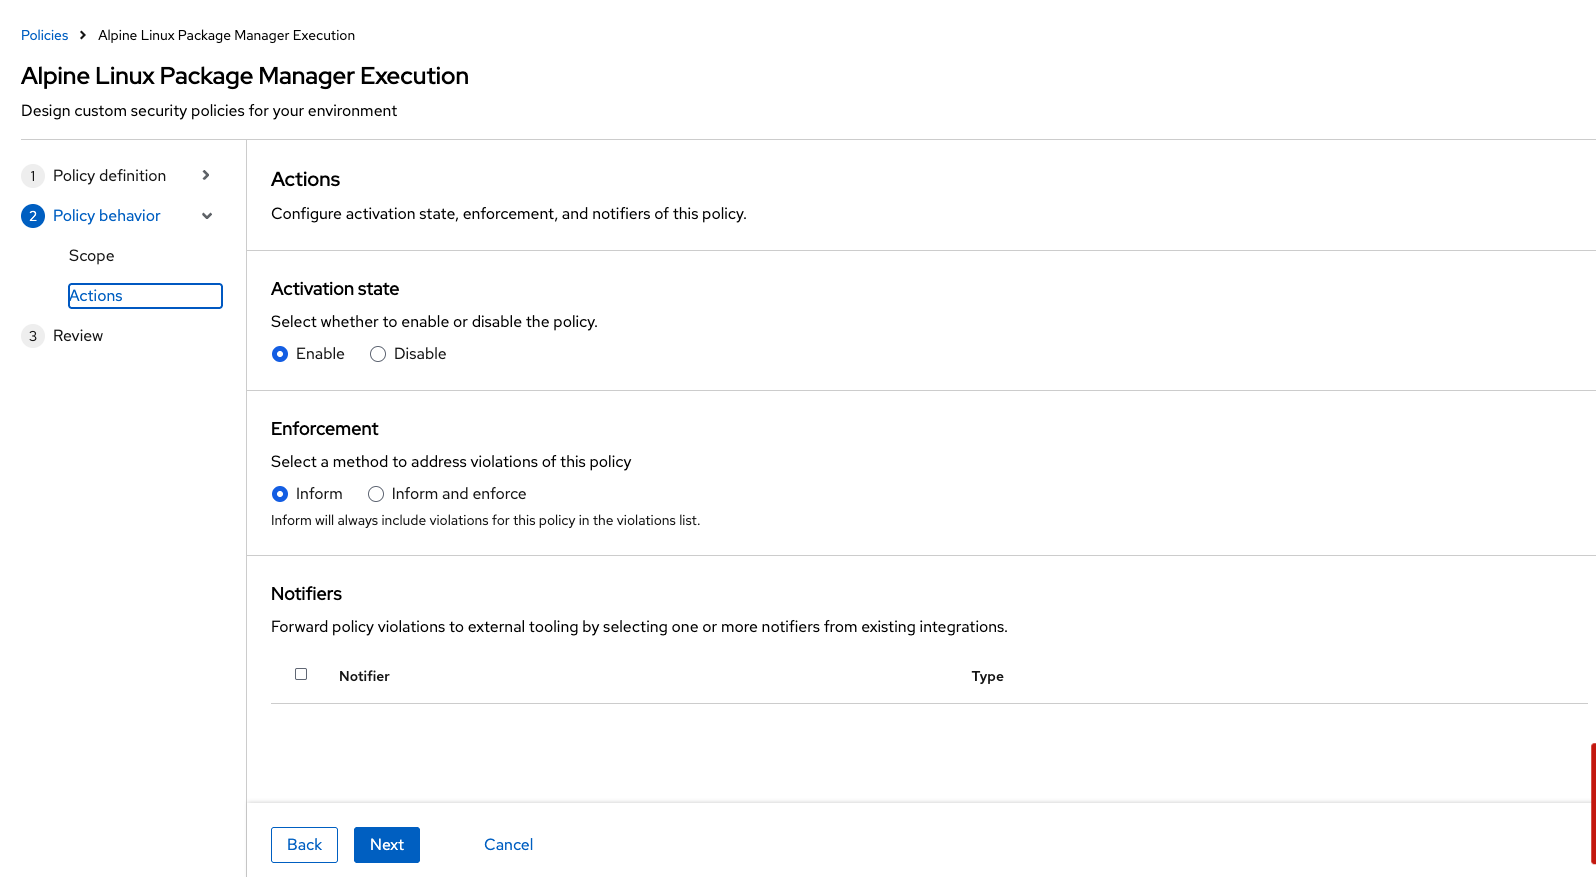
Select Policy Behavior → Actions:
-
Enable runtime enforcement by clicking the inform and enforce button:
-
Configure enforcement behavior by selecting Enforce at Runtime:
-
Click Next:
-
Review the changes, then click save:
| Make sure to save the policy changes! If you do not save the policy, the process will not be blocked! |
3.3. Testing the configured policy
Use tmux to watch OpenShift events while you trigger the policy.
| Make sure that you are signed into the bastion host with OpenShift access when running the following commands. |
Procedure . In the terminal, start tmux with two panes:
tmux new-session \; split-window -v \; attach-
Next, run a watch on OpenShift events in the first shell pane:
oc get events -n patient-portal -w-
Press
Ctrl+bfirst, and then press o to switch to the next pane. (Hold ctrl+b, then press o): -
Exec into the frontend application:
POD=$(oc get pod -l app=frontend -n patient-portal -o jsonpath="{.items[0].metadata.name}")
oc exec $POD -n patient-portal -i --tty -- /bin/bash
If you see /home/fritz, you’ve confirmed shell access to the frontend container.
-
Run the apk package manager in this shell:
apk updateExpected: Package manager starts, then the shell terminates with exit code 137. In the events pane, RHACS Killing the pod and a replacement pod is Created.
| After a few seconds, the pod is deleted and recreated and your exec session ends. Type exit, press Ctrl+c to stop the watch, and exit tmux. |
4. Hands-on with the RHACS Network UI
4.1. CIS Compliance Reminder
In this module, we will focus on the backend namespace. Also, hopefully, you remember the compliance section where we were told how we could become CIS-compliant by applying network policies.
Run the following two commands to remember which namespaces are currently compliant:
cd ~/
export TUTORIAL_HOME="$(pwd)/demo-apps"
oc get --all-namespaces networkpolicies -o json | jq '[.items[] | select((.metadata.namespace | startswith("openshift") | not) and (.metadata.namespace | startswith("kube-") | not) and .metadata.namespace != "default") | .metadata.namespace] | unique'
Sample output
[
 "medical",
 "stackrox",
 "vault"
]
Now, let’s aim to get the backend namespace on that list.
4.2. The Network Graph UI
Procedure
-
Start by heading to the Network → Network Graph.
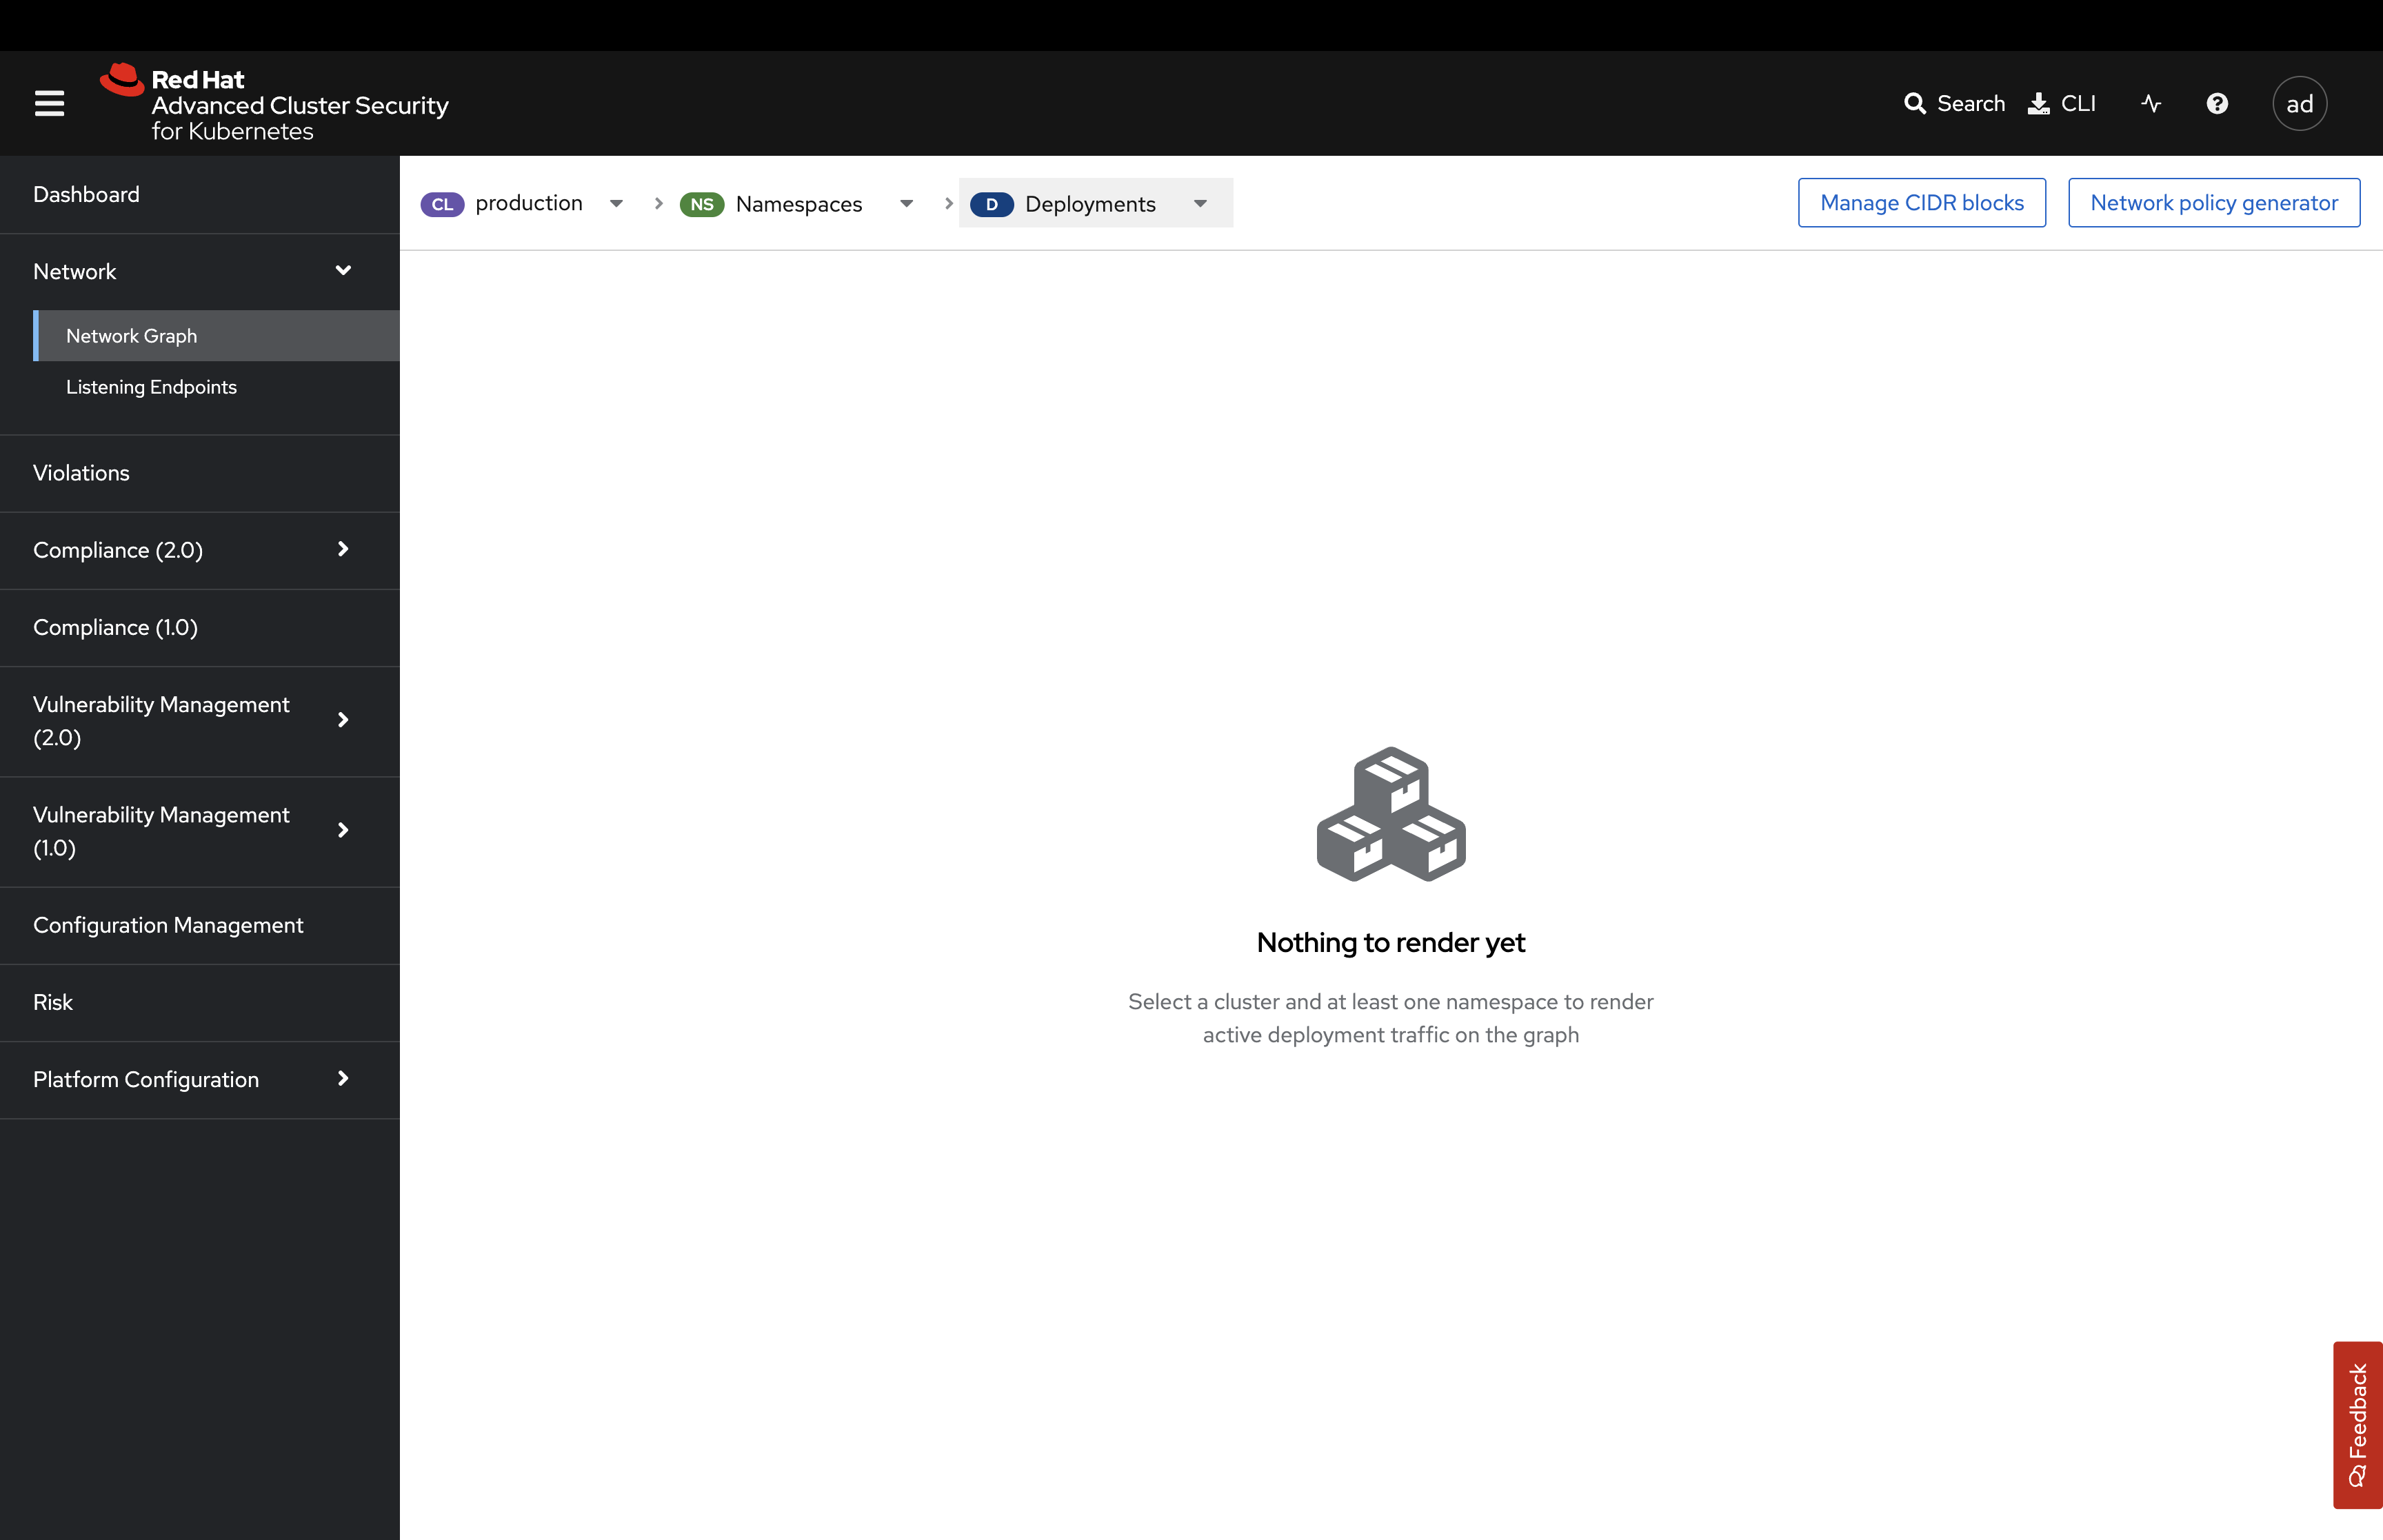
The graph does not display any results by default. This is a performance choice as large environments will become unwieldy in a dashboard like this.
-
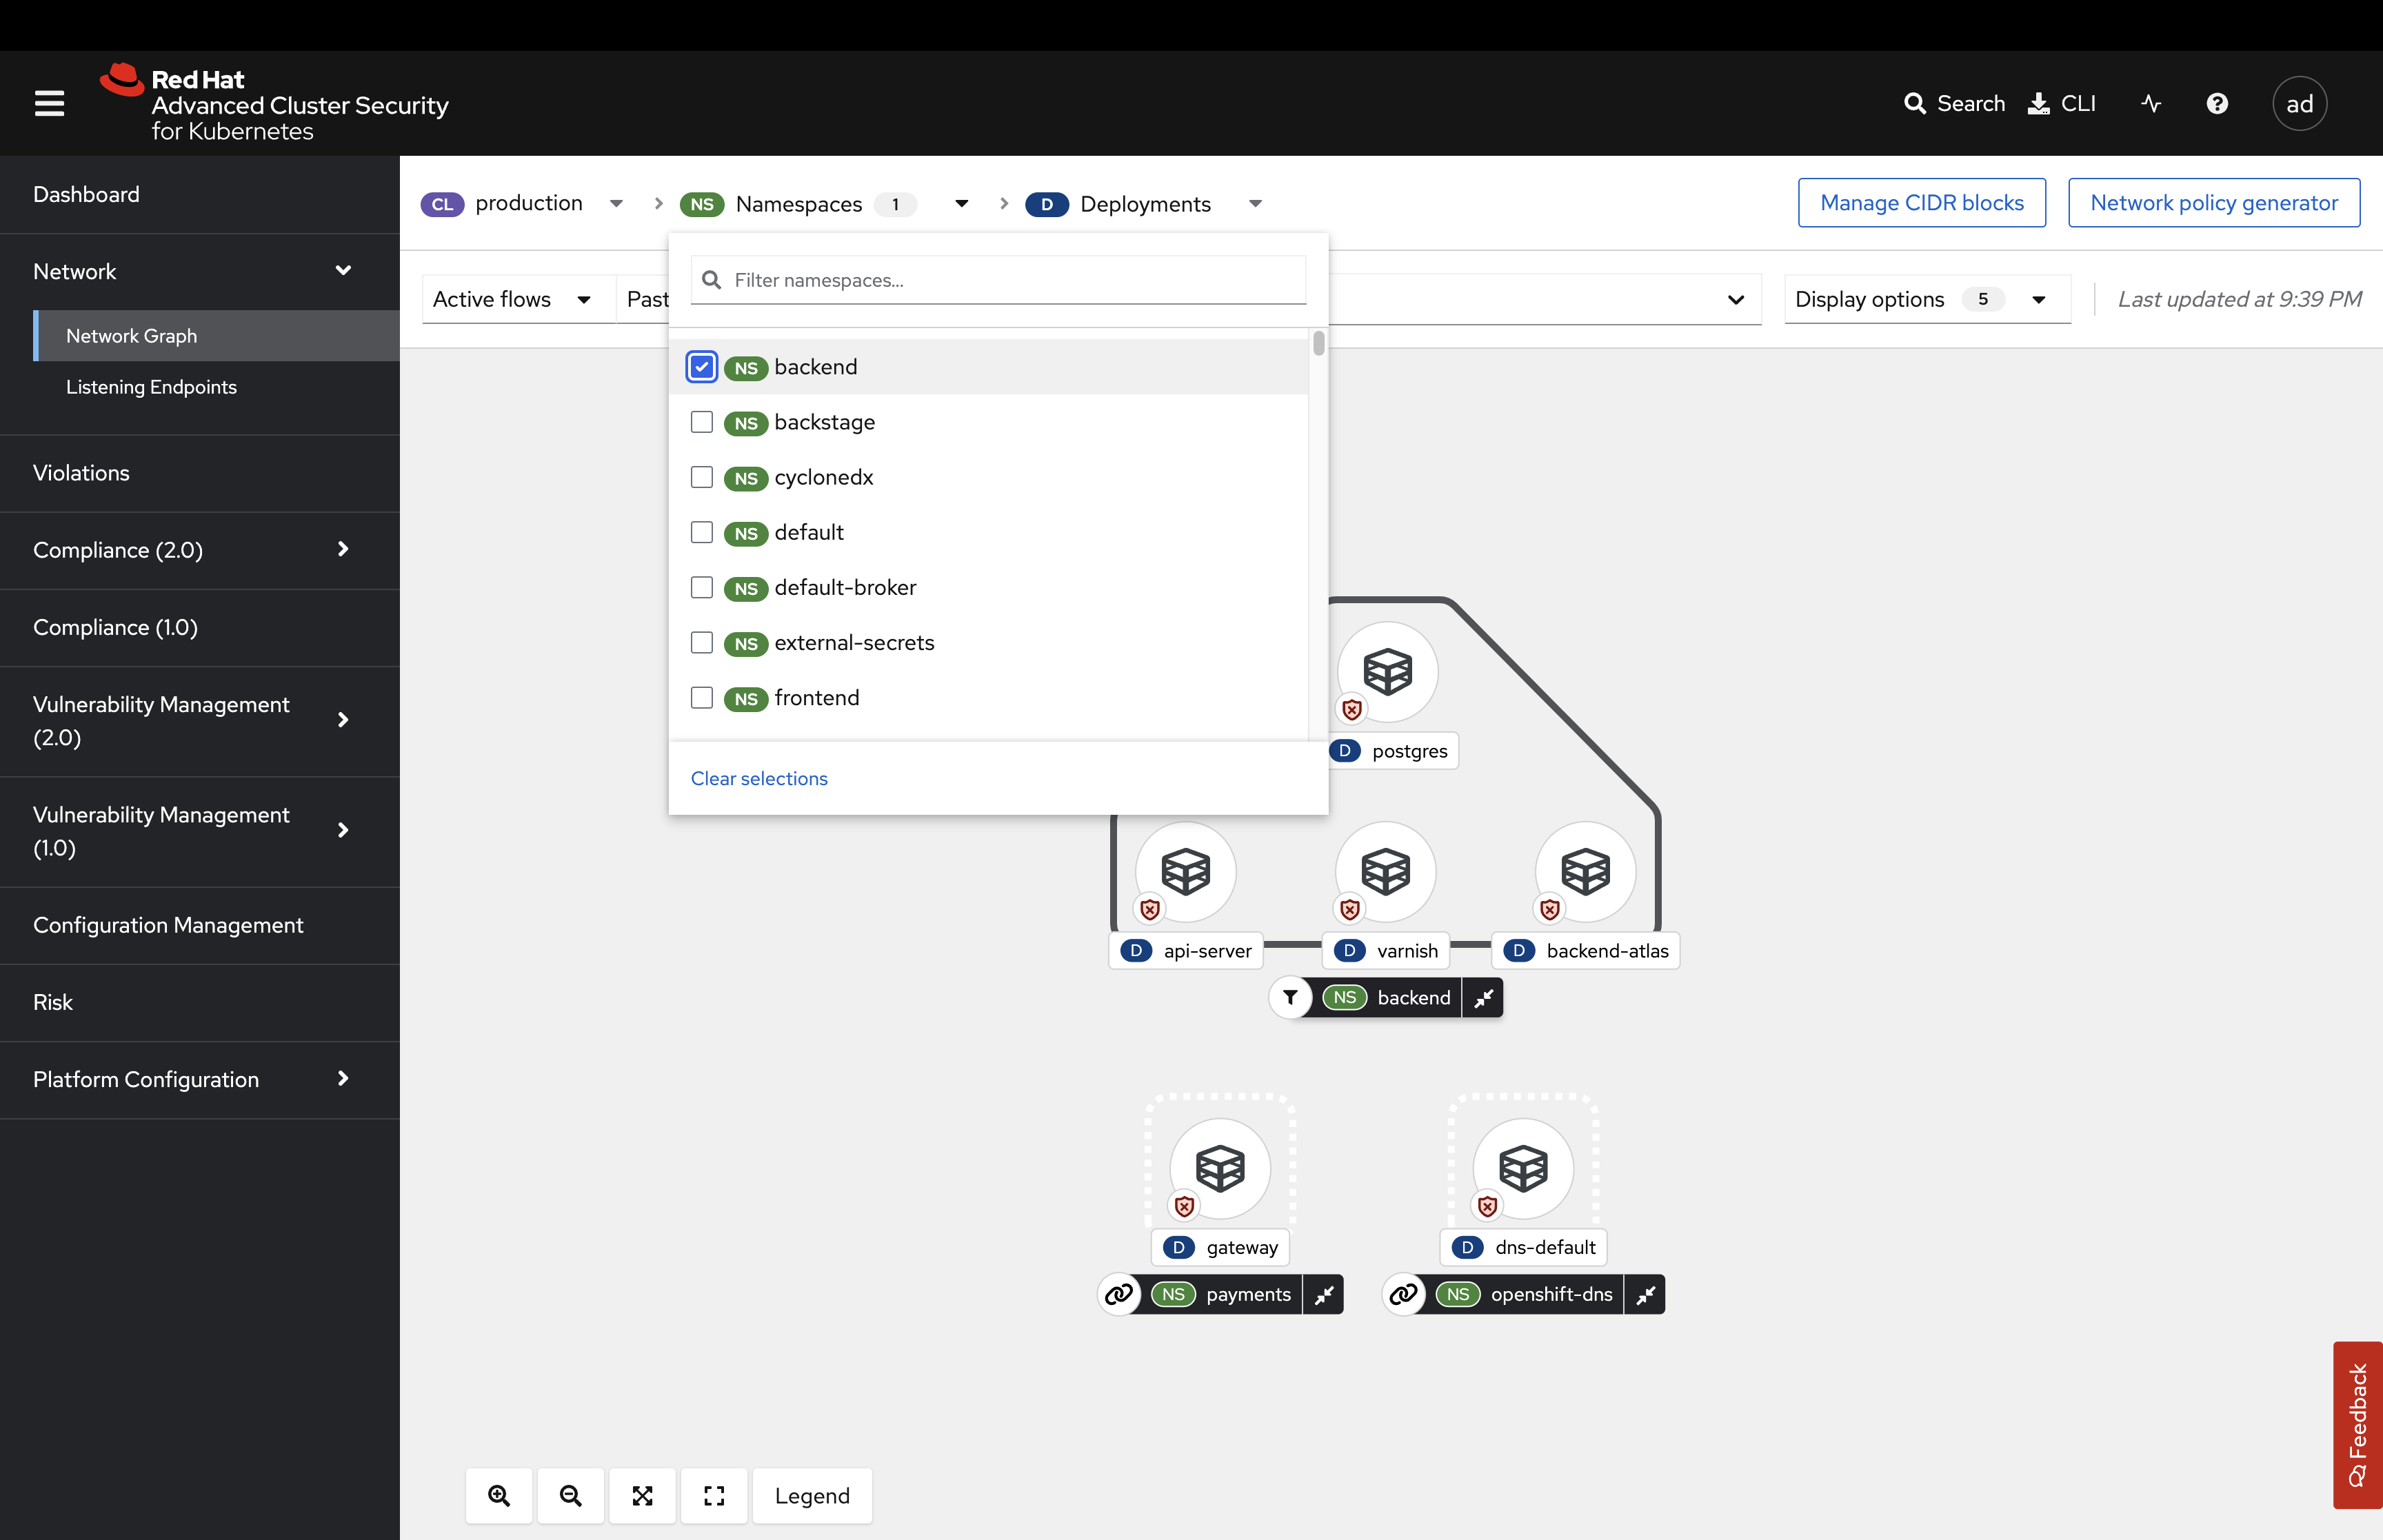
Use the filters at the top to select ONLY the backend namespace.
-
Review the legend at the bottom left of the page.
Notice how there is a namespace type labeled Related namespace. You should see two other namespaces related to the backend namespace. This is because there is network traffic between these three namespaces.
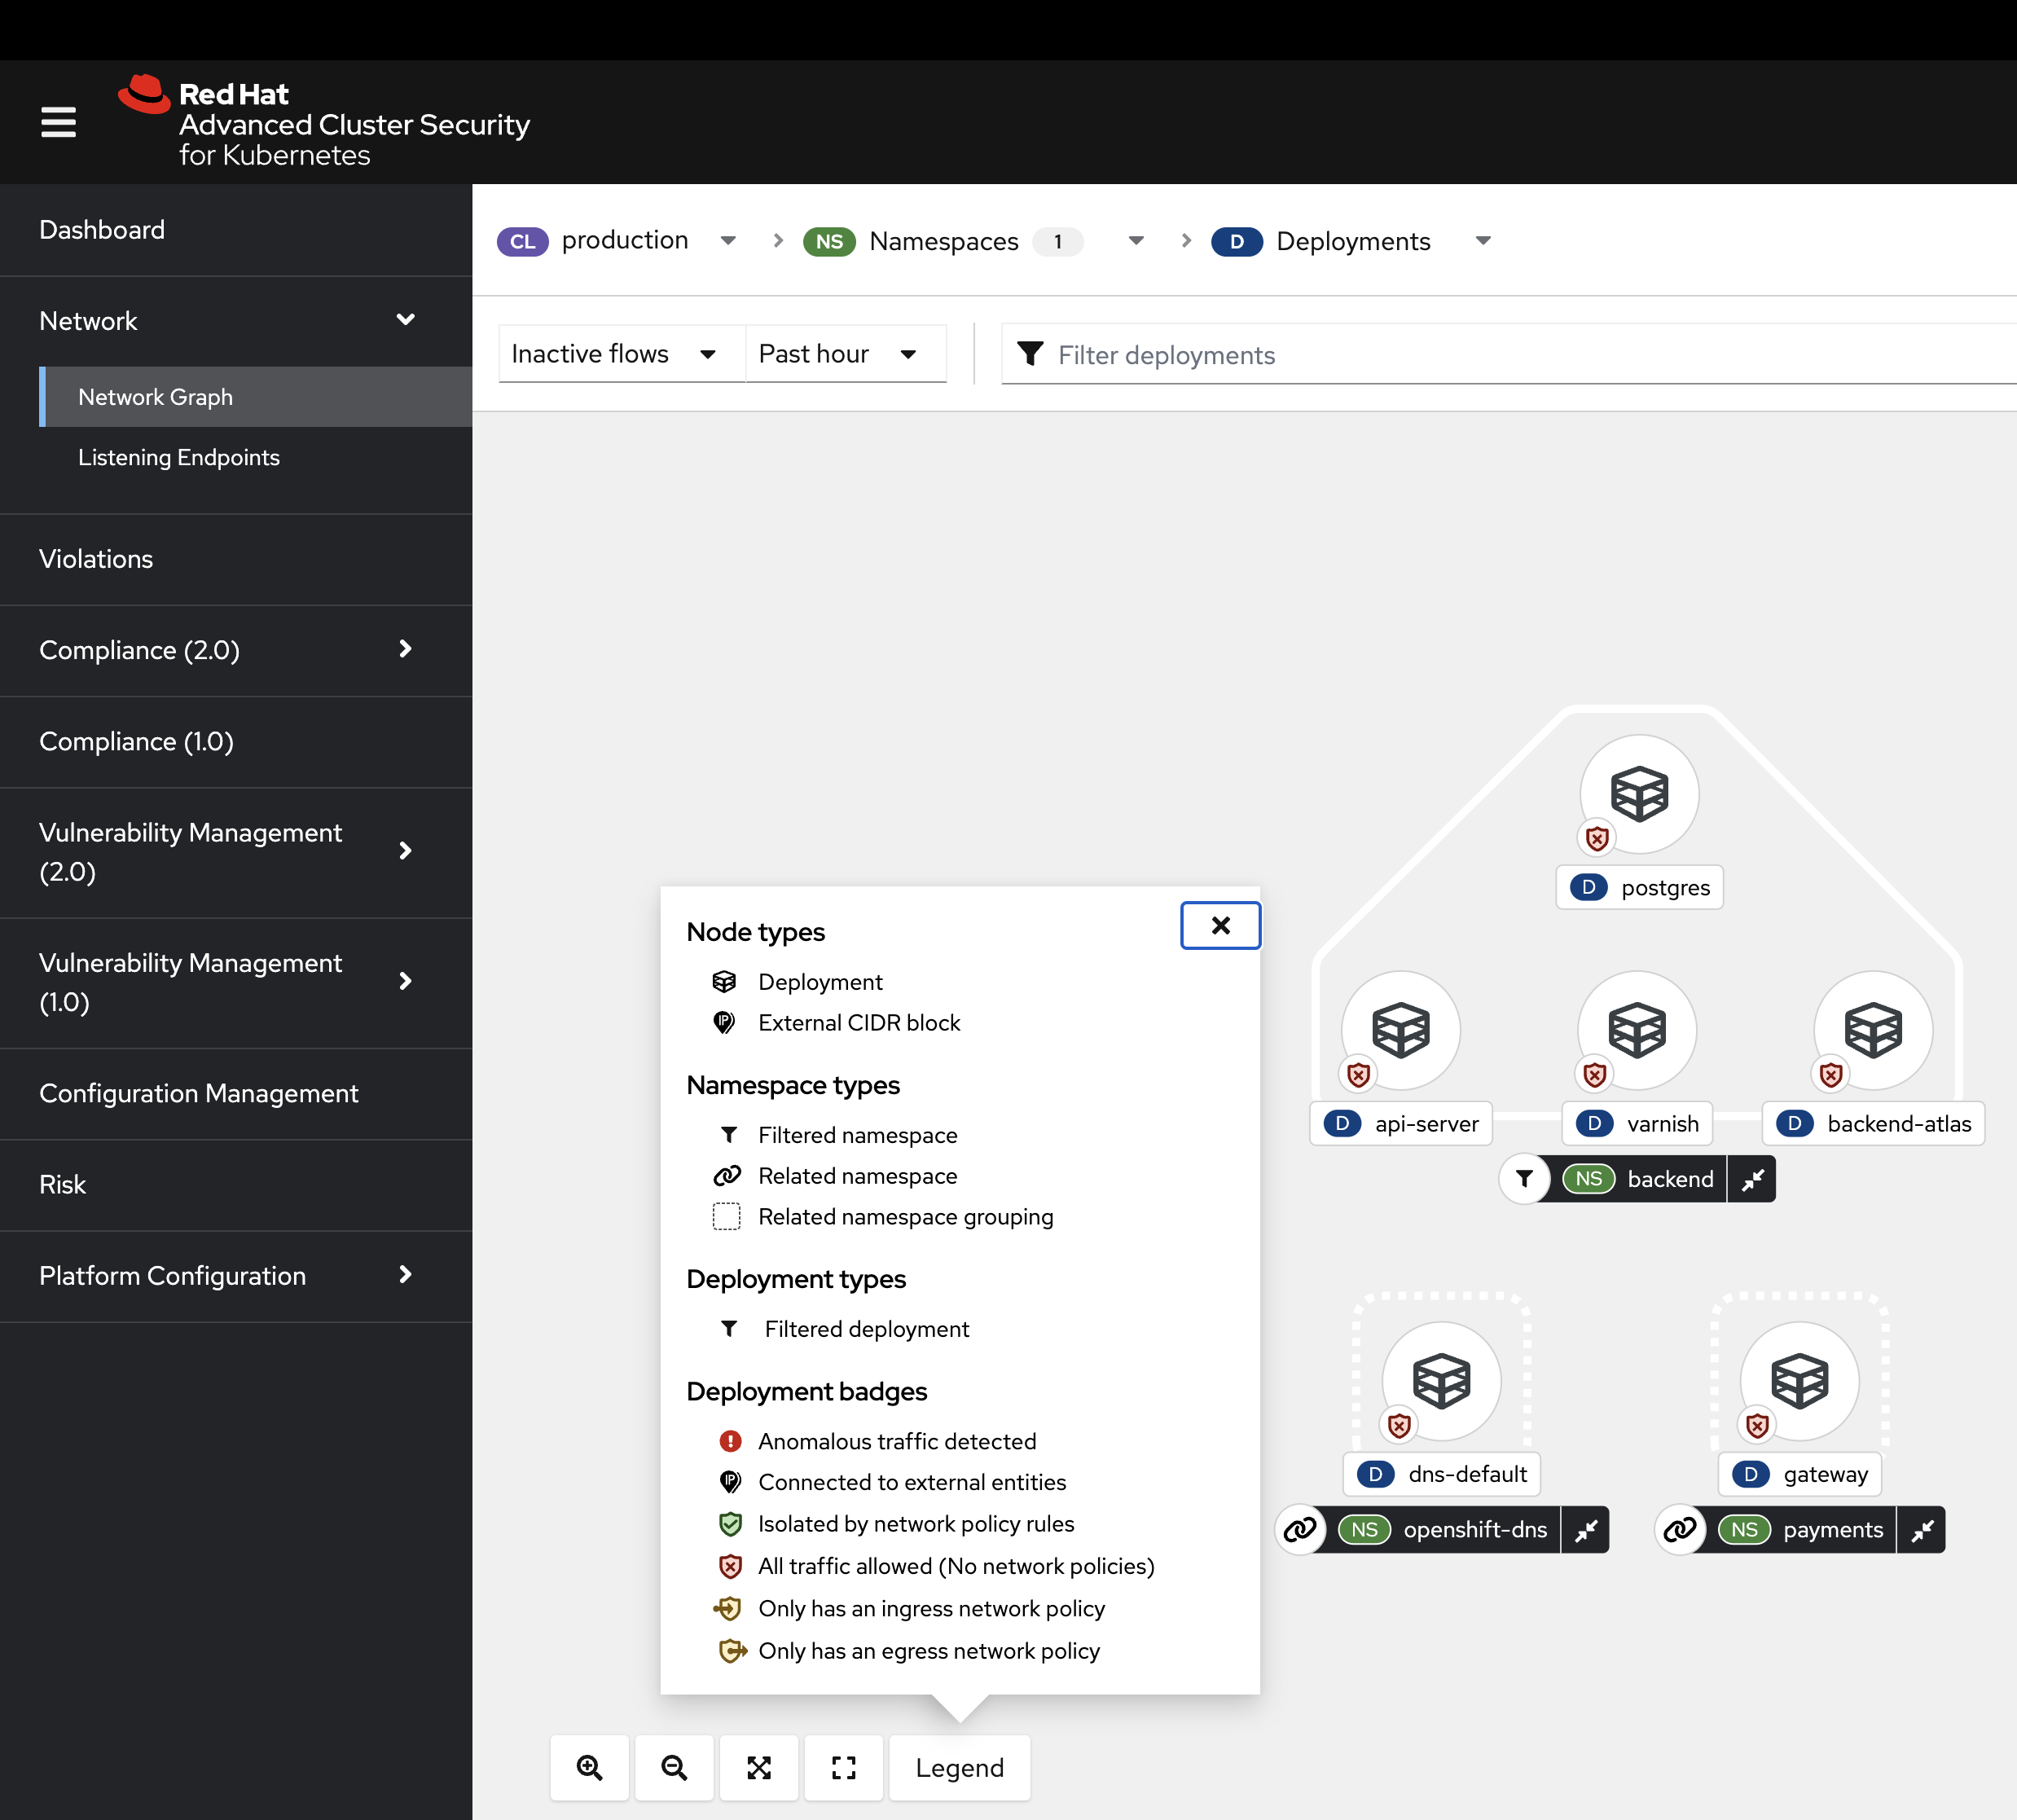
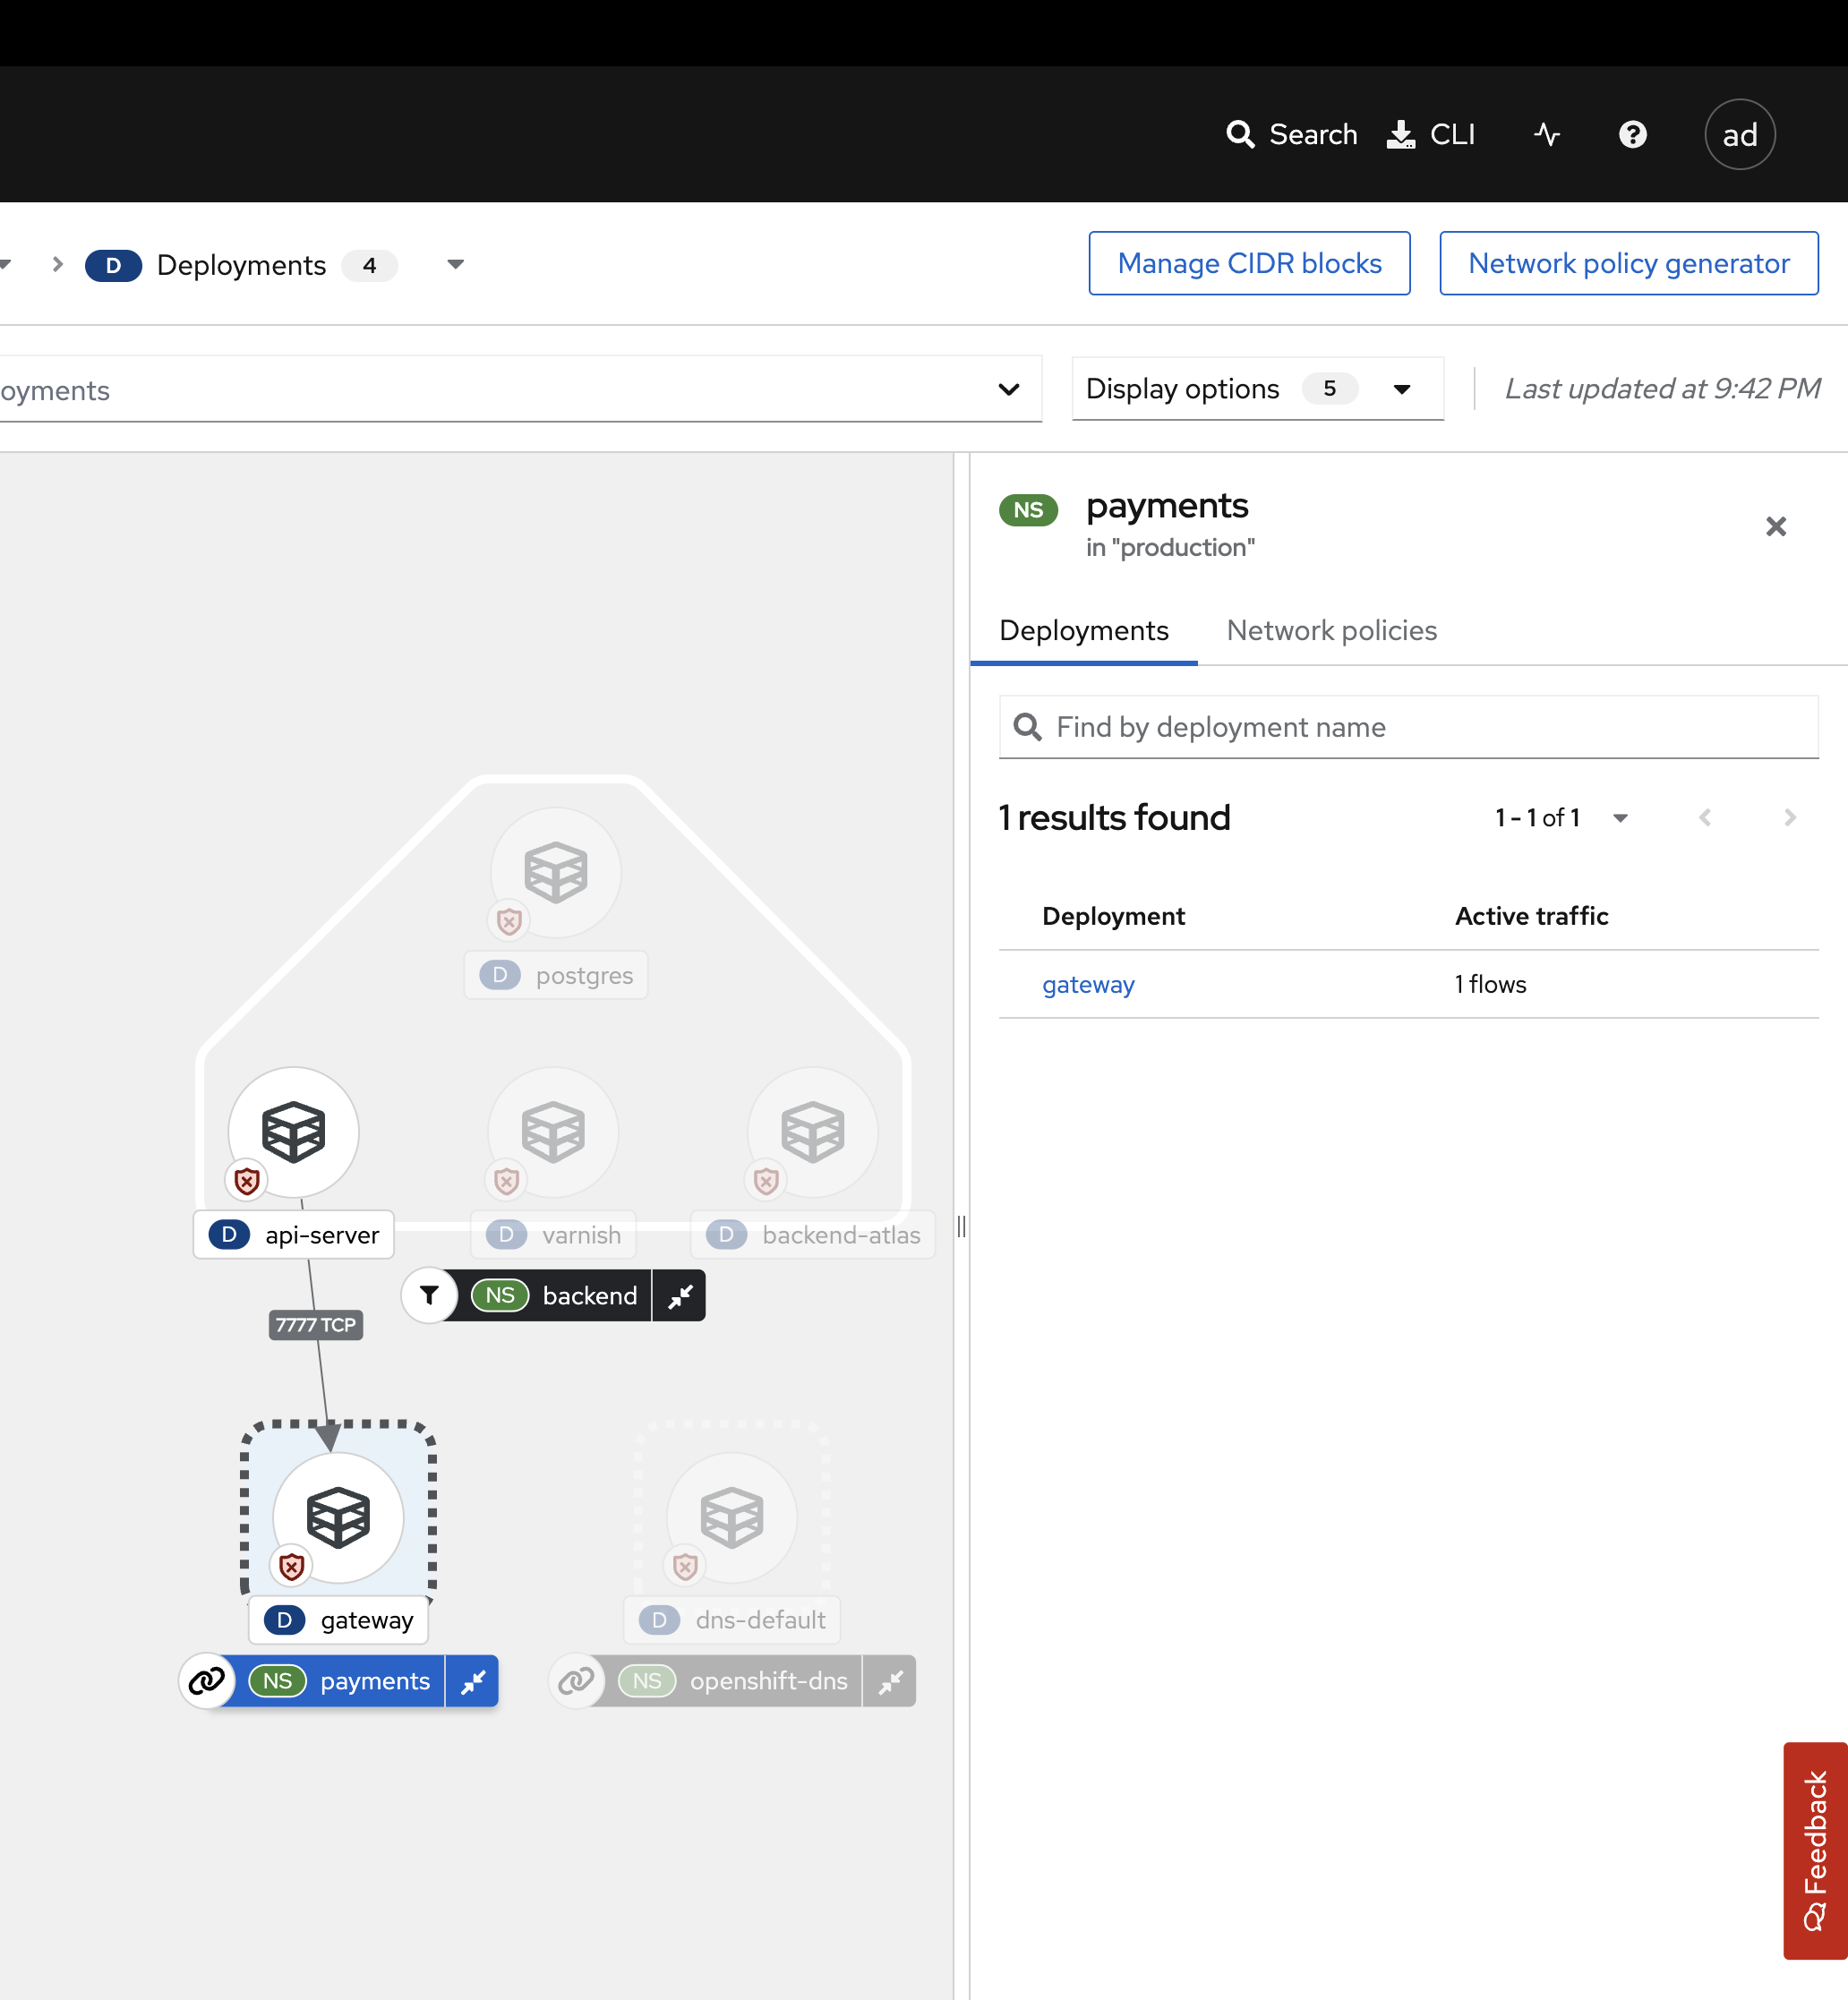
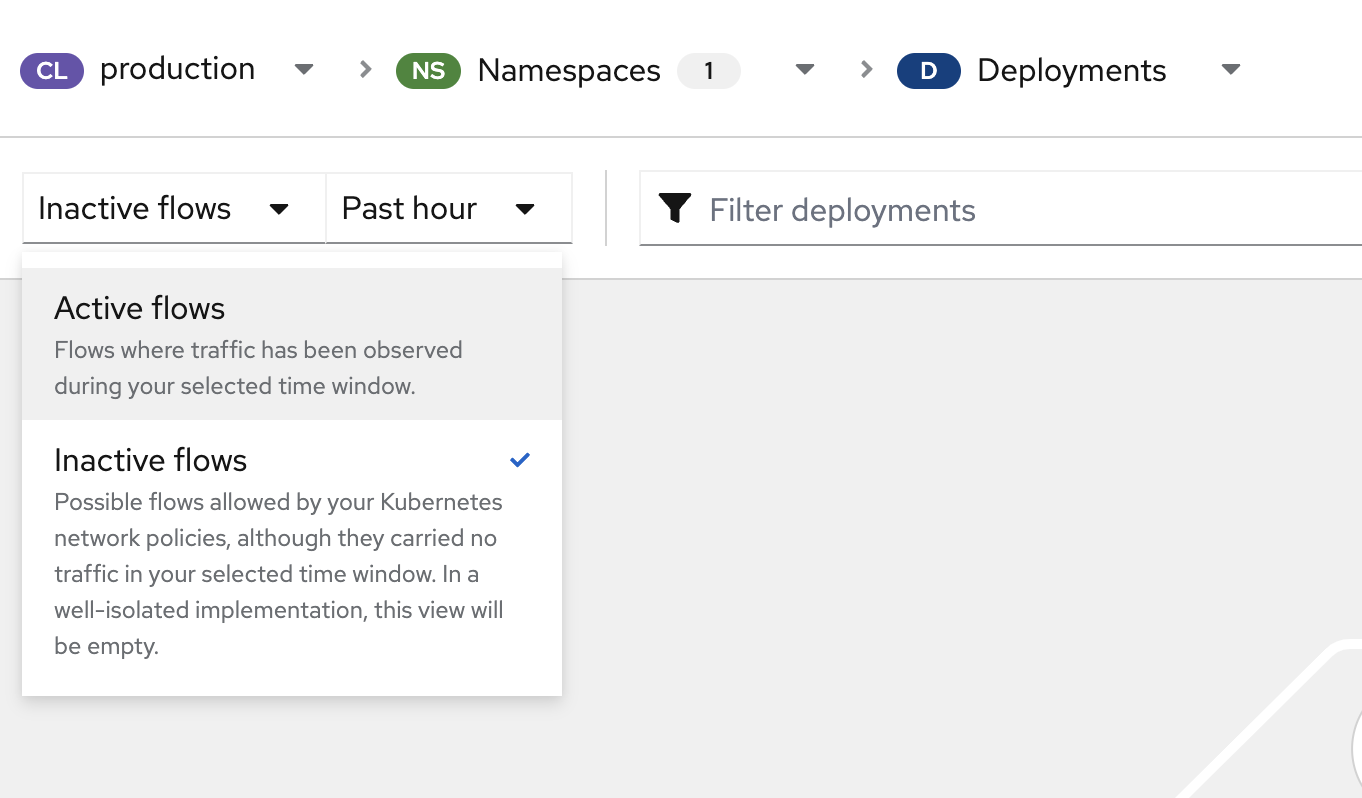
You can also filter by "Active flows" or "Inactive flows."
-
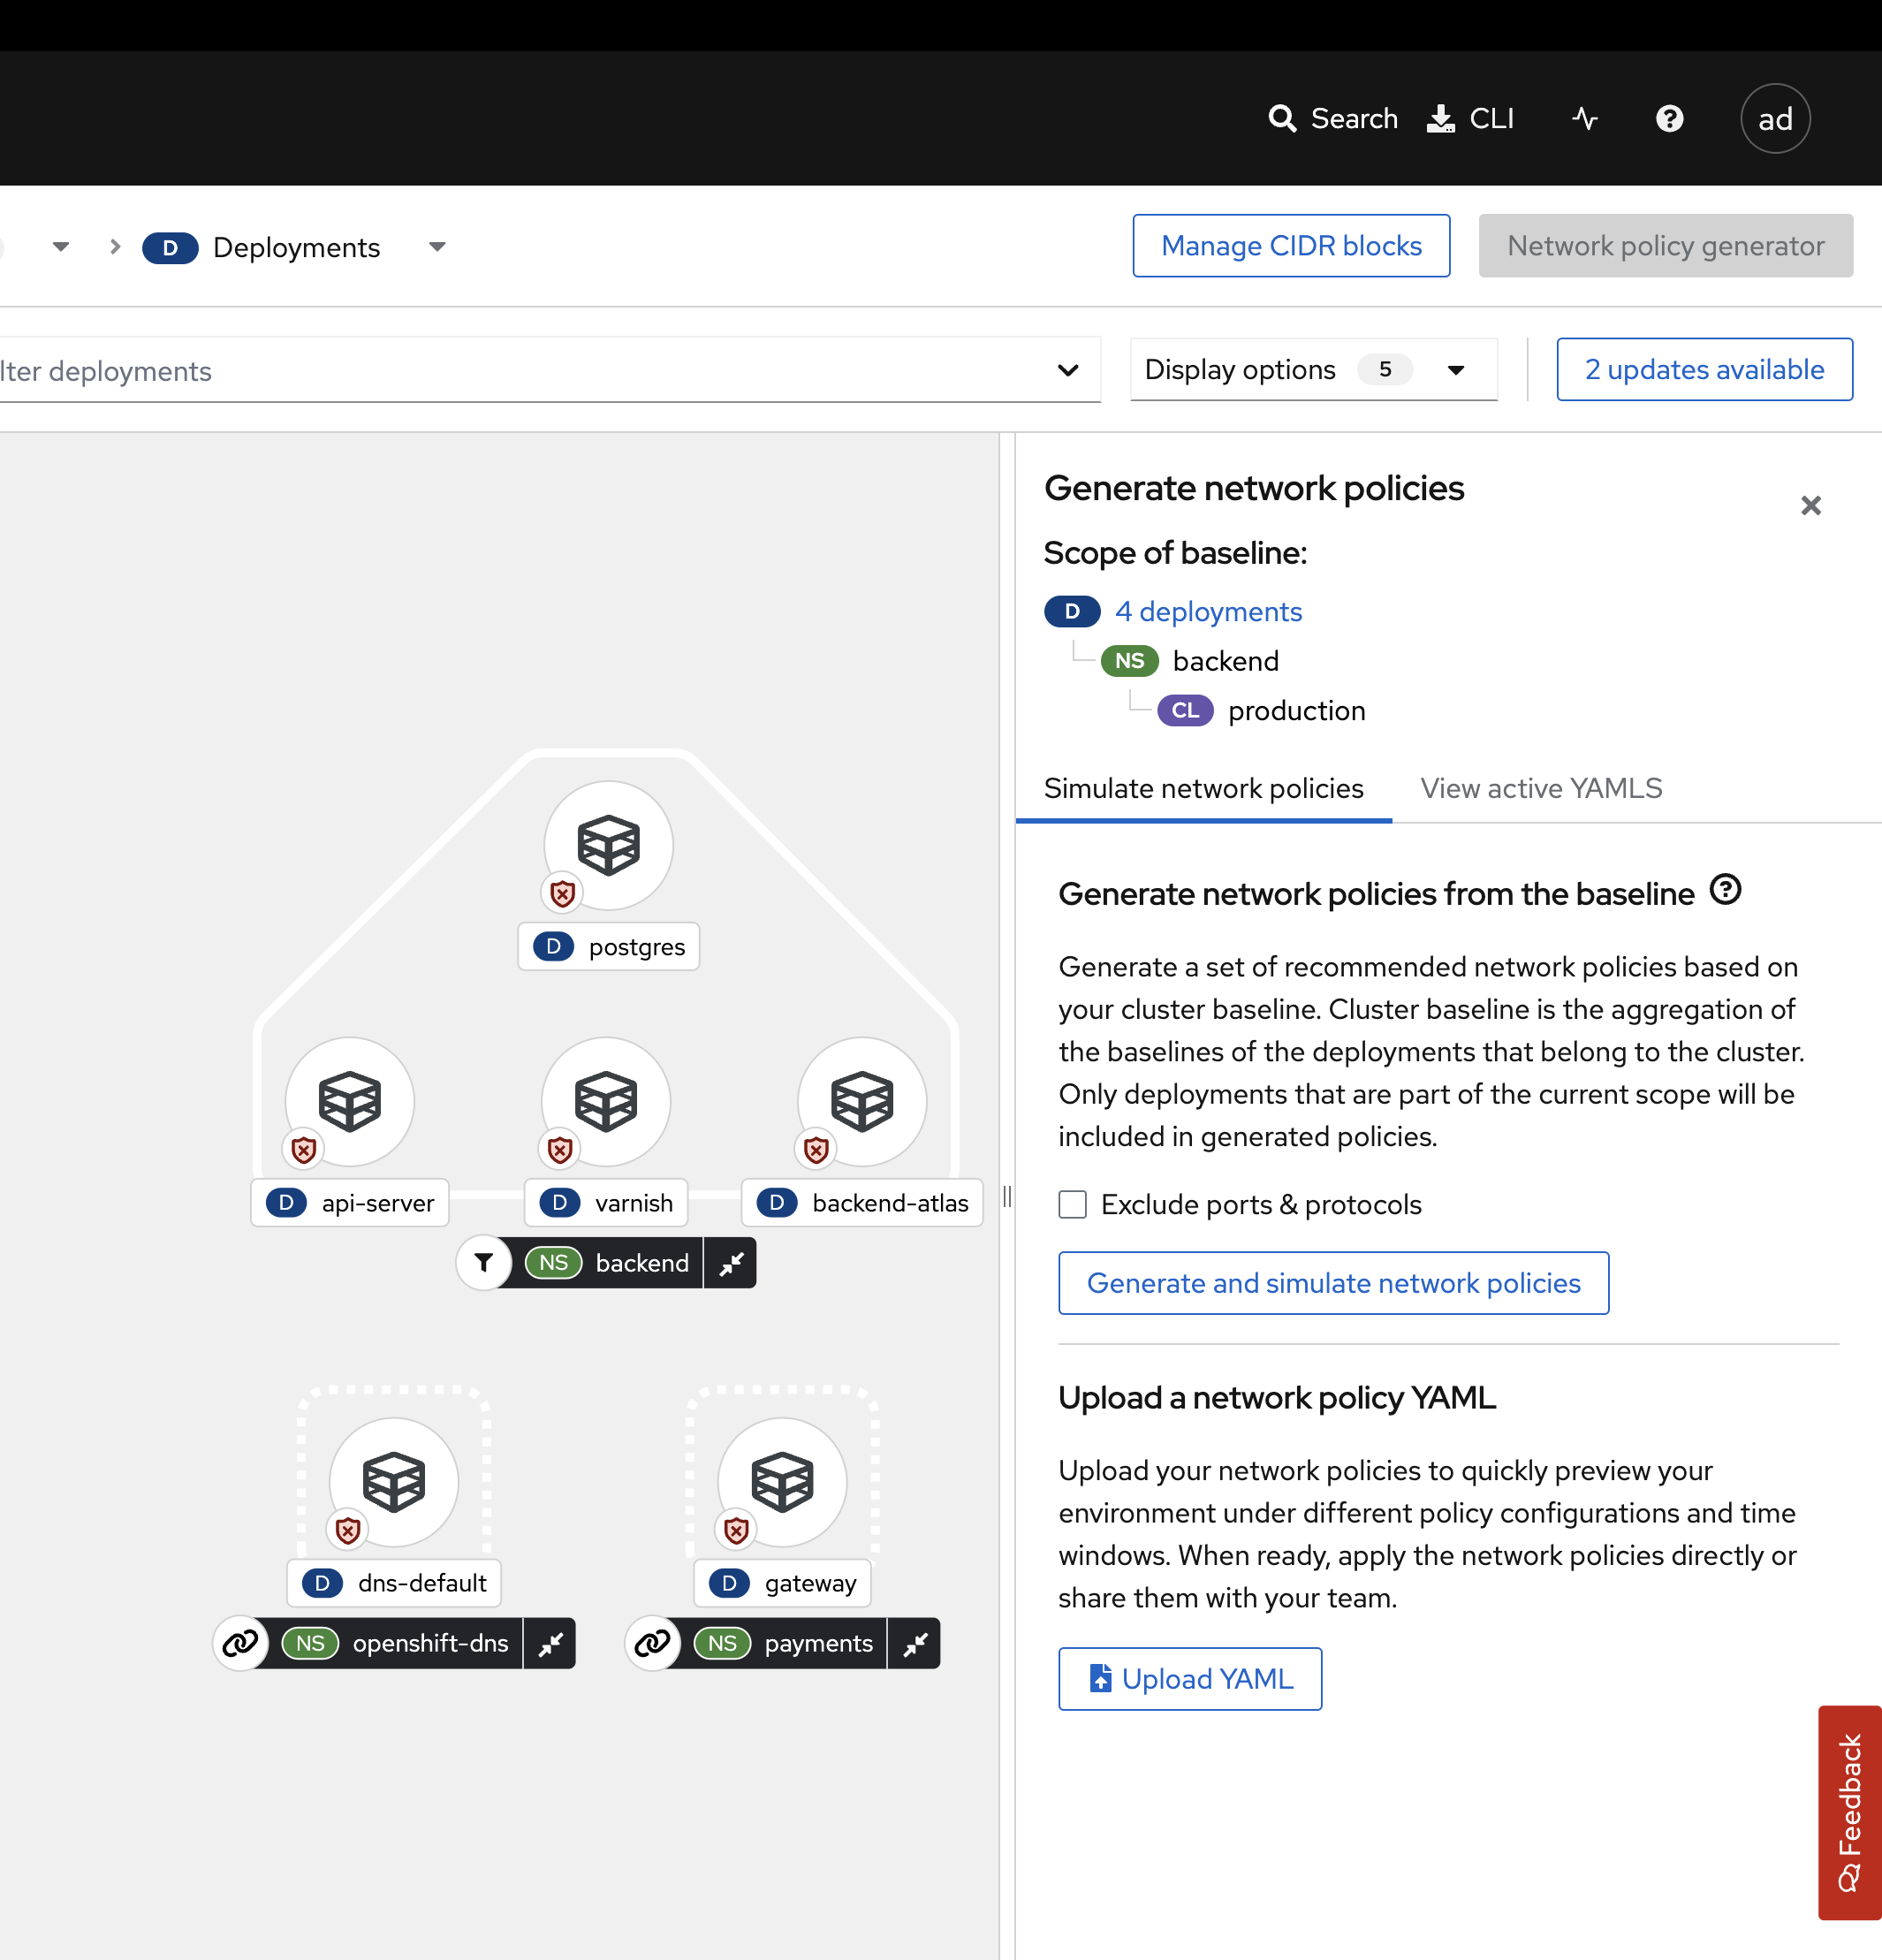
Click on the Network policy generator on the top right of the dashboard.
-
Click the View active YAMLS tab.
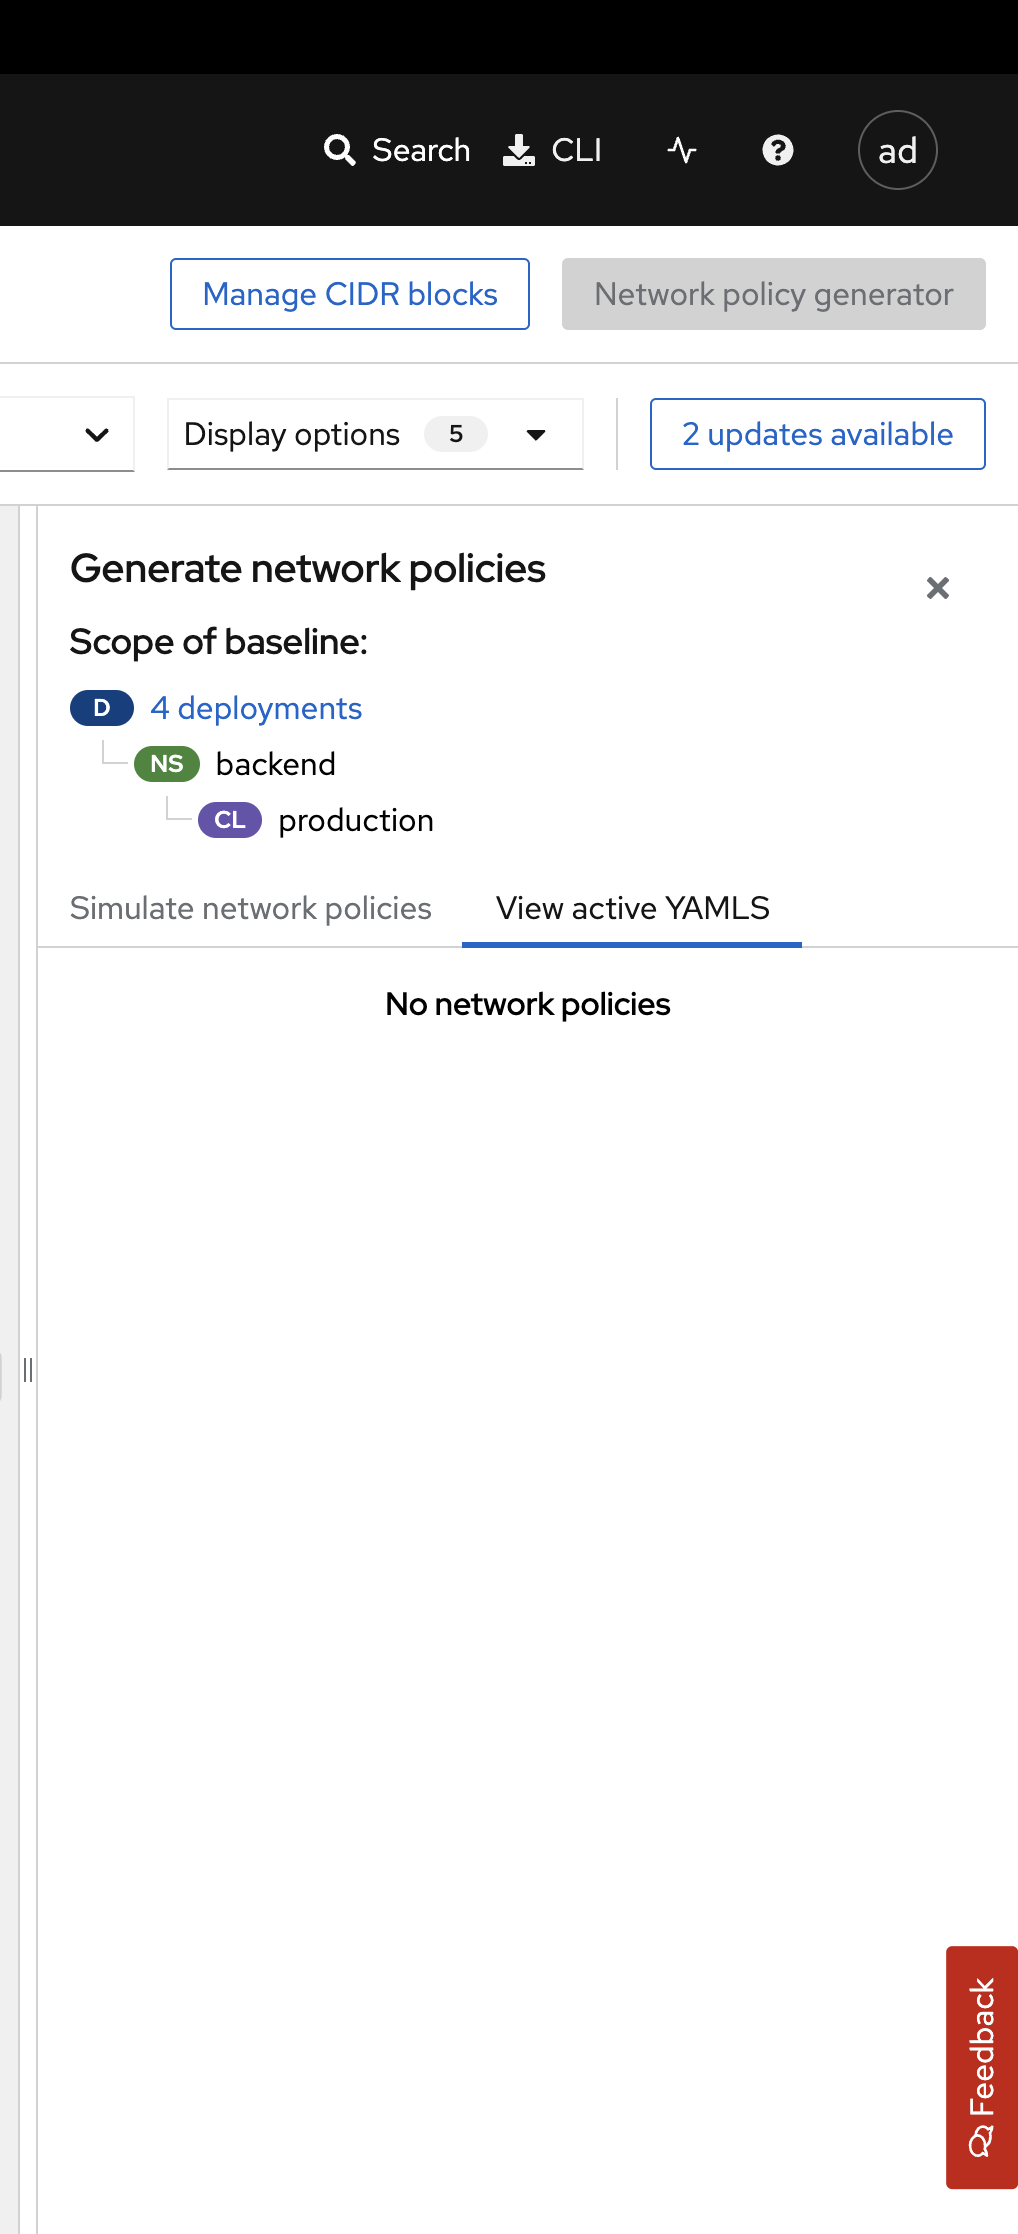
| You should see no active YAMLs in the namespace since we have not created any network policies in the backend namespace. |
-
Click the Simulate network policies and click Generate and simulate network policies.
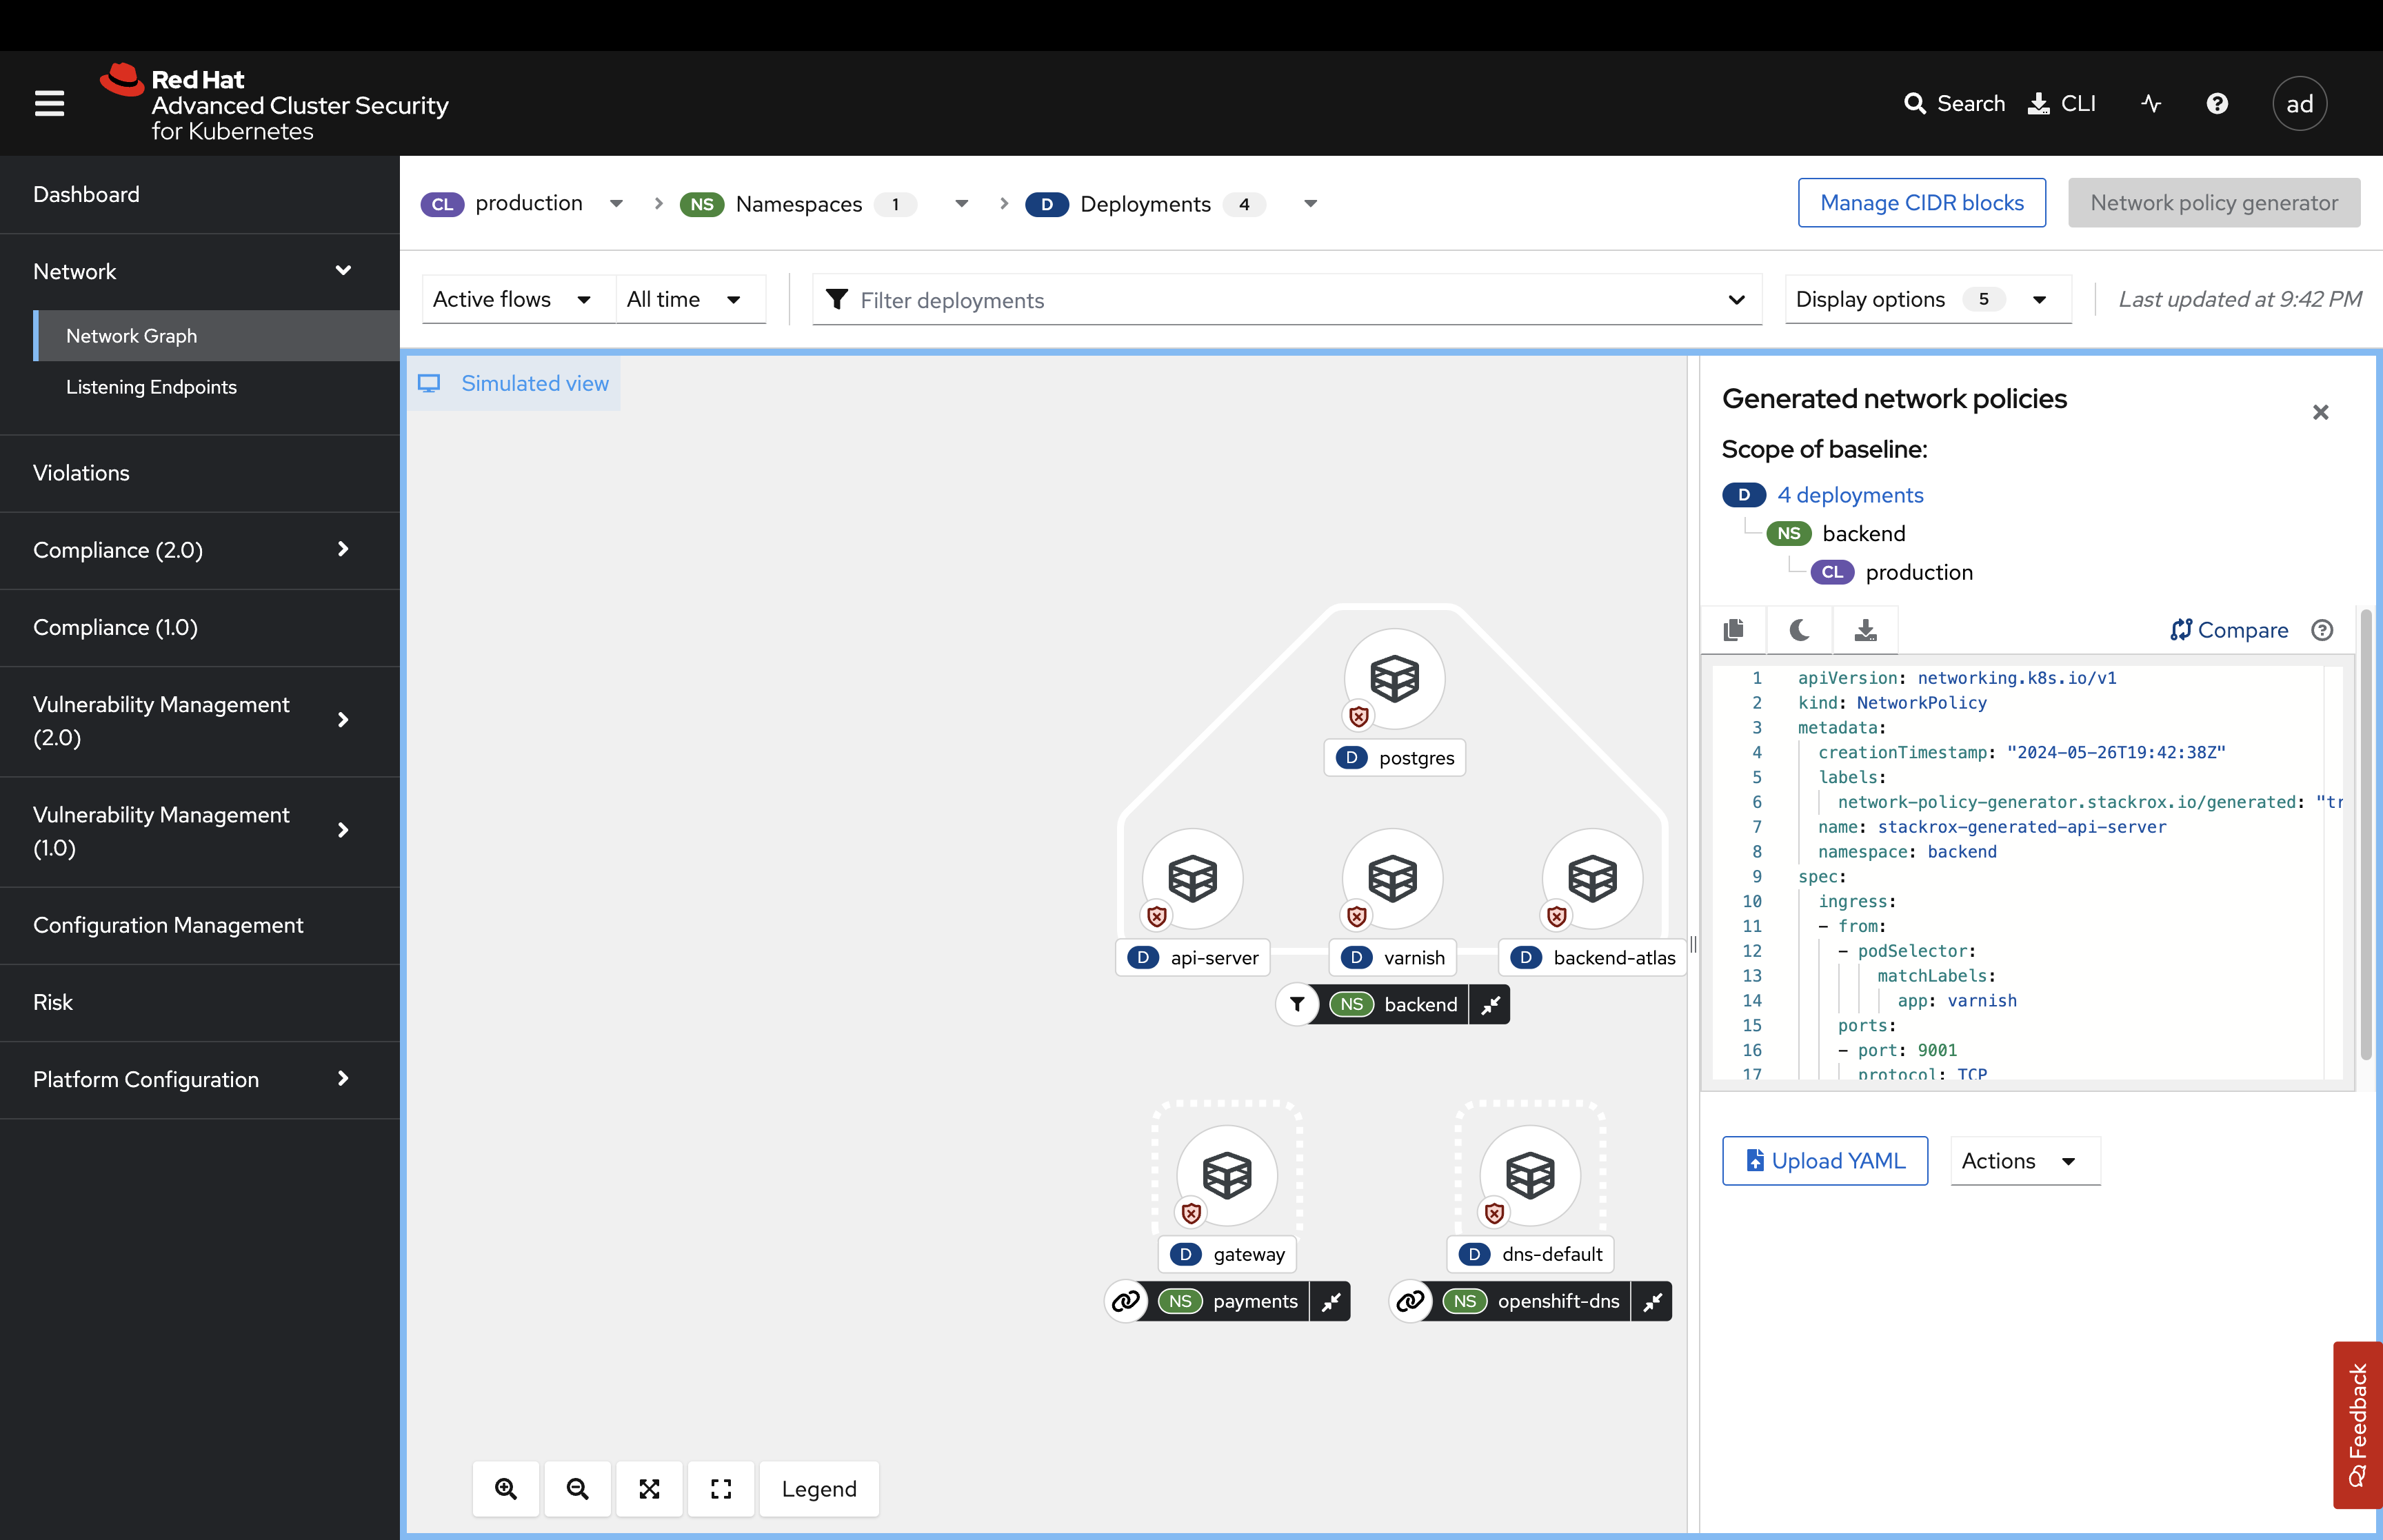
-
Click the Compare tab on the right side of the page:
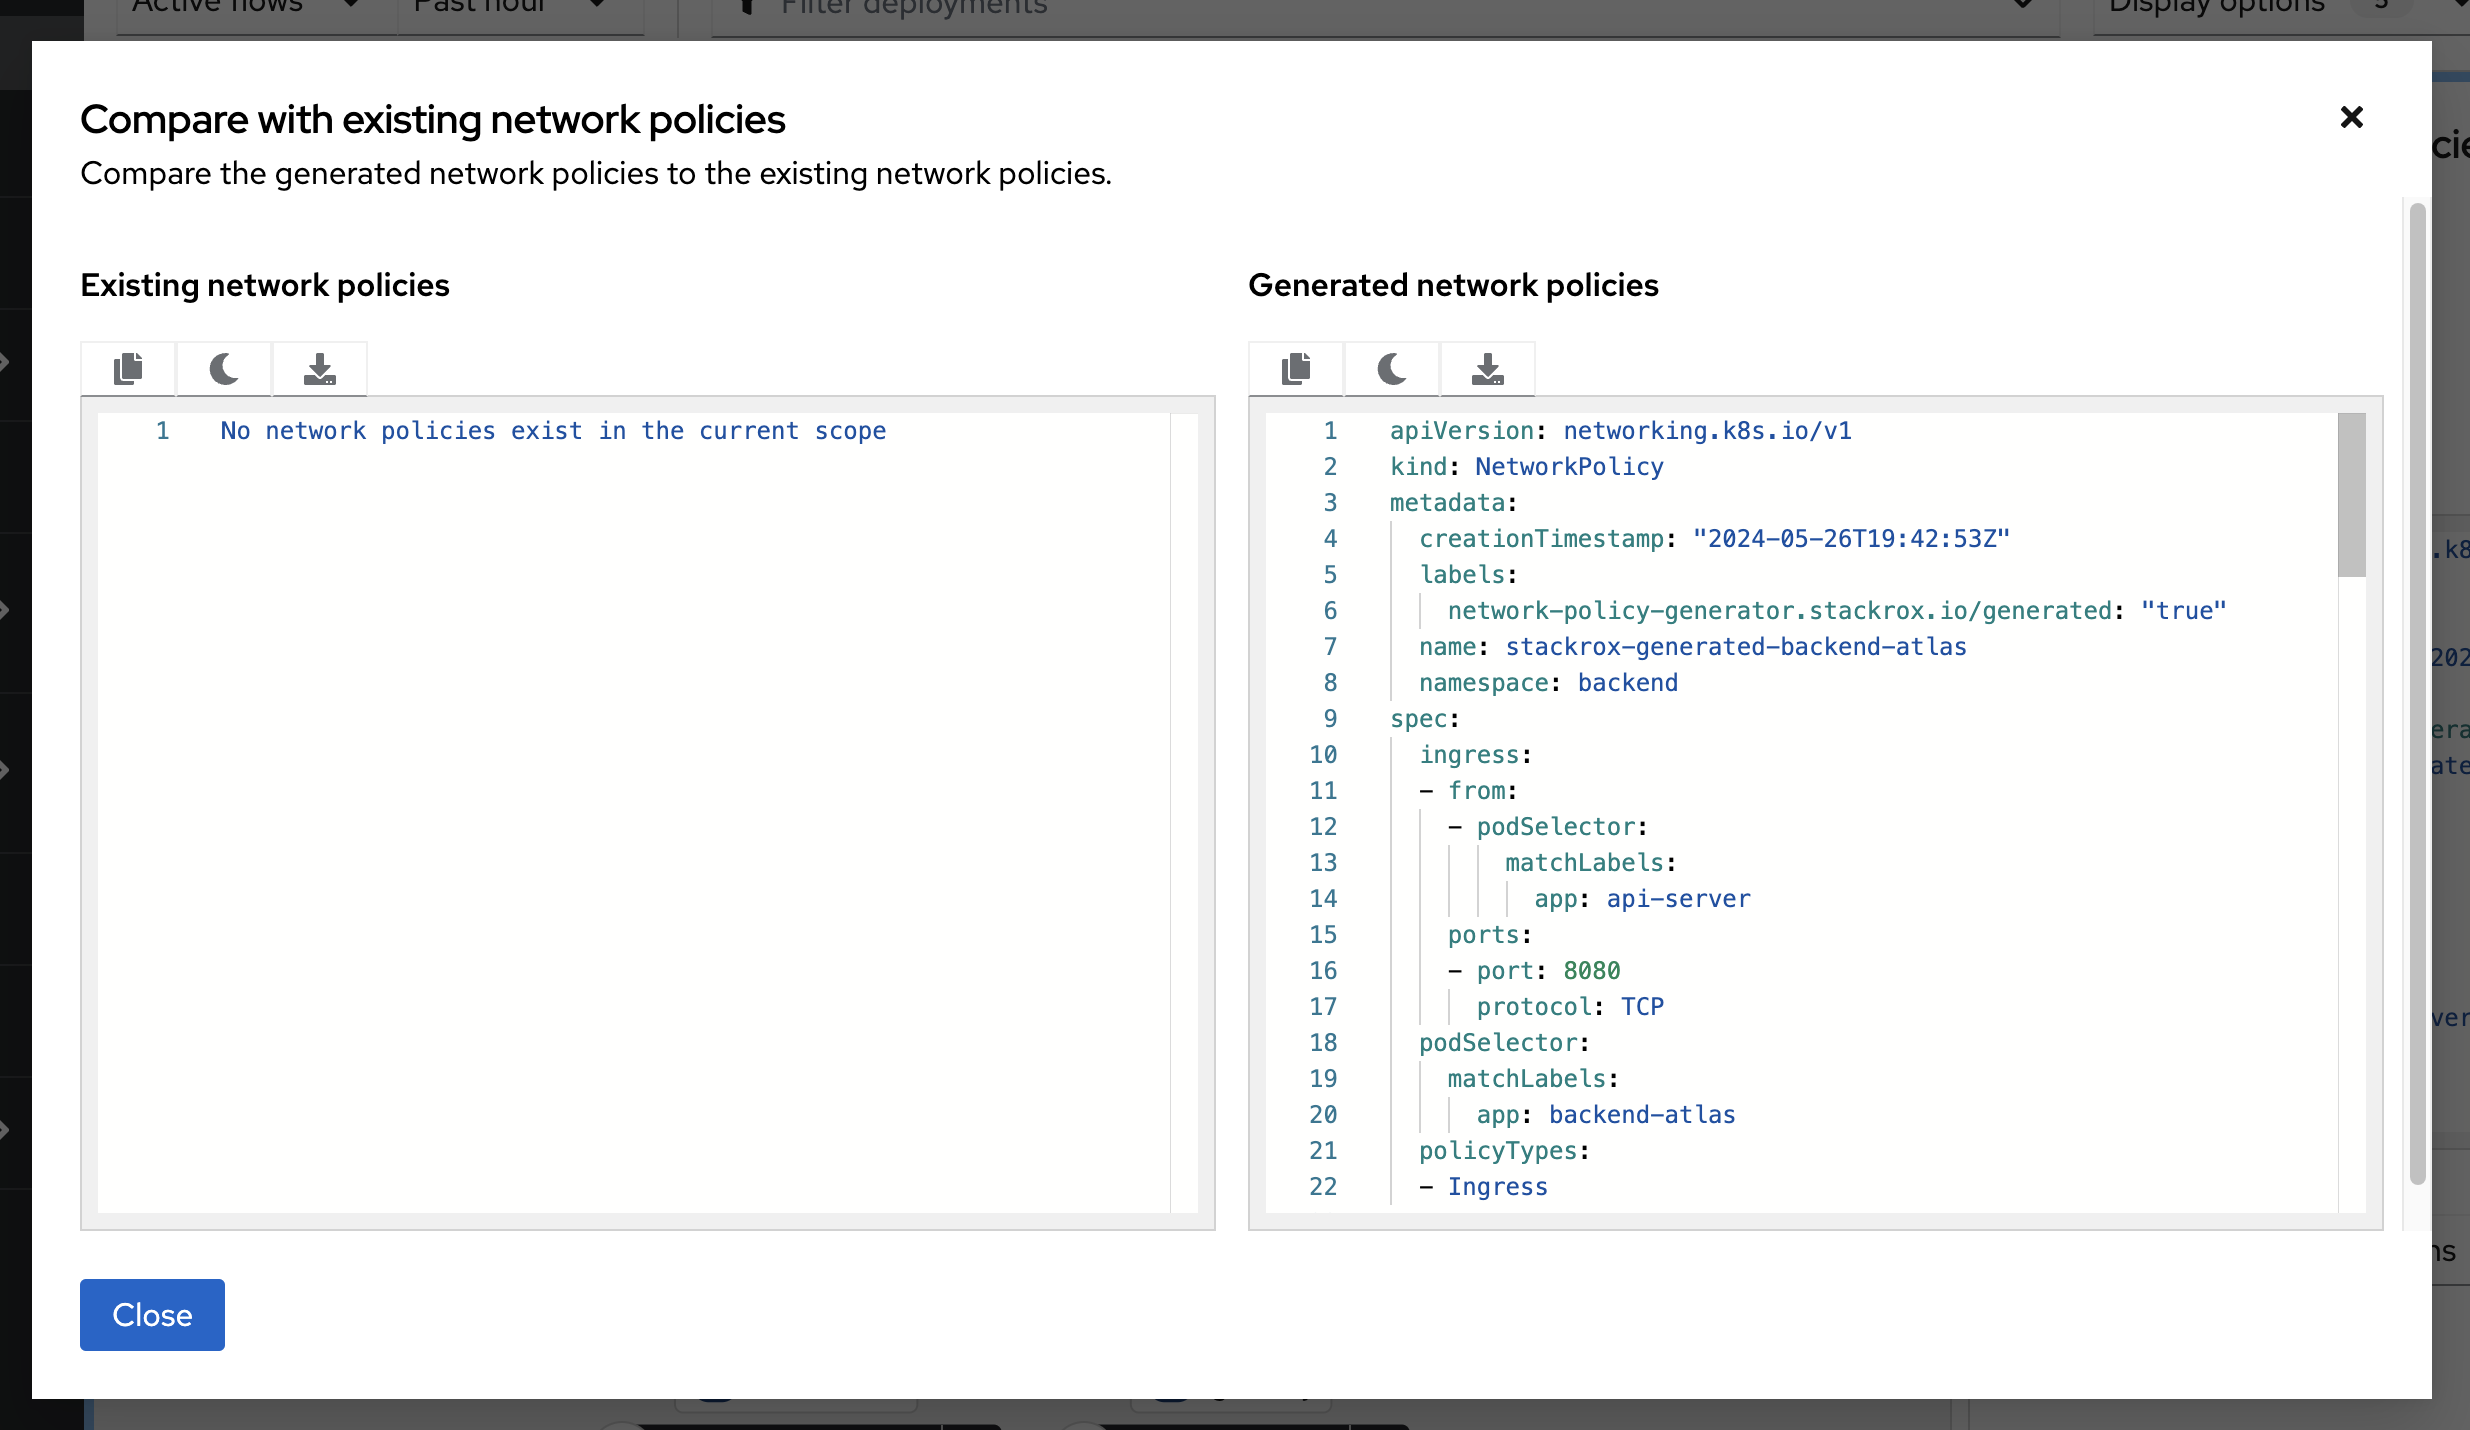
This view is useful for making any changes to network policies. You will be able to visualize the changes in the UI.
We know the backend namespace needs some work. And while we can copy the simulated network policies from the UI, let’s do it later from the roxctl UI.
5. Using the roxctl netpol CLI
We’re going to use the roxctl netpol command to generate network policies based on the Backend applications.
First, let’s take a look at the four applications and all of their associated services:
-
Run the following command.
export TUTORIAL_HOME="$(pwd)/demo-apps"
cat $TUTORIAL_HOME/kubernetes-manifests/medical-application/backend/everything.yml
Sample output
# Deployment named "varnish"
# Listens on :8080
apiVersion: apps/v1
kind: Deployment
metadata:
 name: varnish
.....
You can see the manifest contains EVERYTHING about the applications in the namespace.
| The netpol command only looks at the services and deployment manifests to generate network policies. This is why it is extremely important that the deployments and services are properly configured first. |
-
Run the following command:
roxctl netpol connectivity map $TUTORIAL_HOME/kubernetes-manifests/medical-application/backend/everything.ymlSample output
....
backend/postgres[Deployment] => backend/api-server[Deployment] : All Connections
backend/postgres[Deployment] => backend/backend-atlas[Deployment] : All Connections
backend/postgres[Deployment] => backend/varnish[Deployment] : All Connections
backend/varnish[Deployment] => 0.0.0.0-255.255.255.255 : All Connections
backend/varnish[Deployment] => backend/api-server[Deployment] : All Connections
backend/varnish[Deployment] => backend/backend-atlas[Deployment] : All Connections
backend/varnish[Deployment] => backend/postgres[Deployment] : All Connections
This output is telling us that all connections are currently authorized into the backend namespace. The goal is to only allow the connections that are necessary for the applications to function.
-
Run the following command. This command will copy the network policy output to an "everything" file and will display what was added:
roxctl netpol generate $TUTORIAL_HOME/kubernetes-manifests/medical-application/backend/everything.yml >> $TUTORIAL_HOME/kubernetes-manifests/medical-application/backend/everything.yml
roxctl netpol generate $TUTORIAL_HOME/kubernetes-manifests/medical-application/backend/everything.yml
Now we have network policies! Time to put them to work.
-
Apply the network policies with the following command:
oc apply -f $TUTORIAL_HOME/kubernetes-manifests/medical-application/backend/everything.ymlSample output
networkpolicy.networking.k8s.io/api-server-netpol created
networkpolicy.networking.k8s.io/backend-atlas-netpol created
networkpolicy.networking.k8s.io/postgres-netpol created
networkpolicy.networking.k8s.io/varnish-netpol created
networkpolicy.networking.k8s.io/default-deny-in-namespace-backend created-
And go and verify that everything is green in the dashboard:
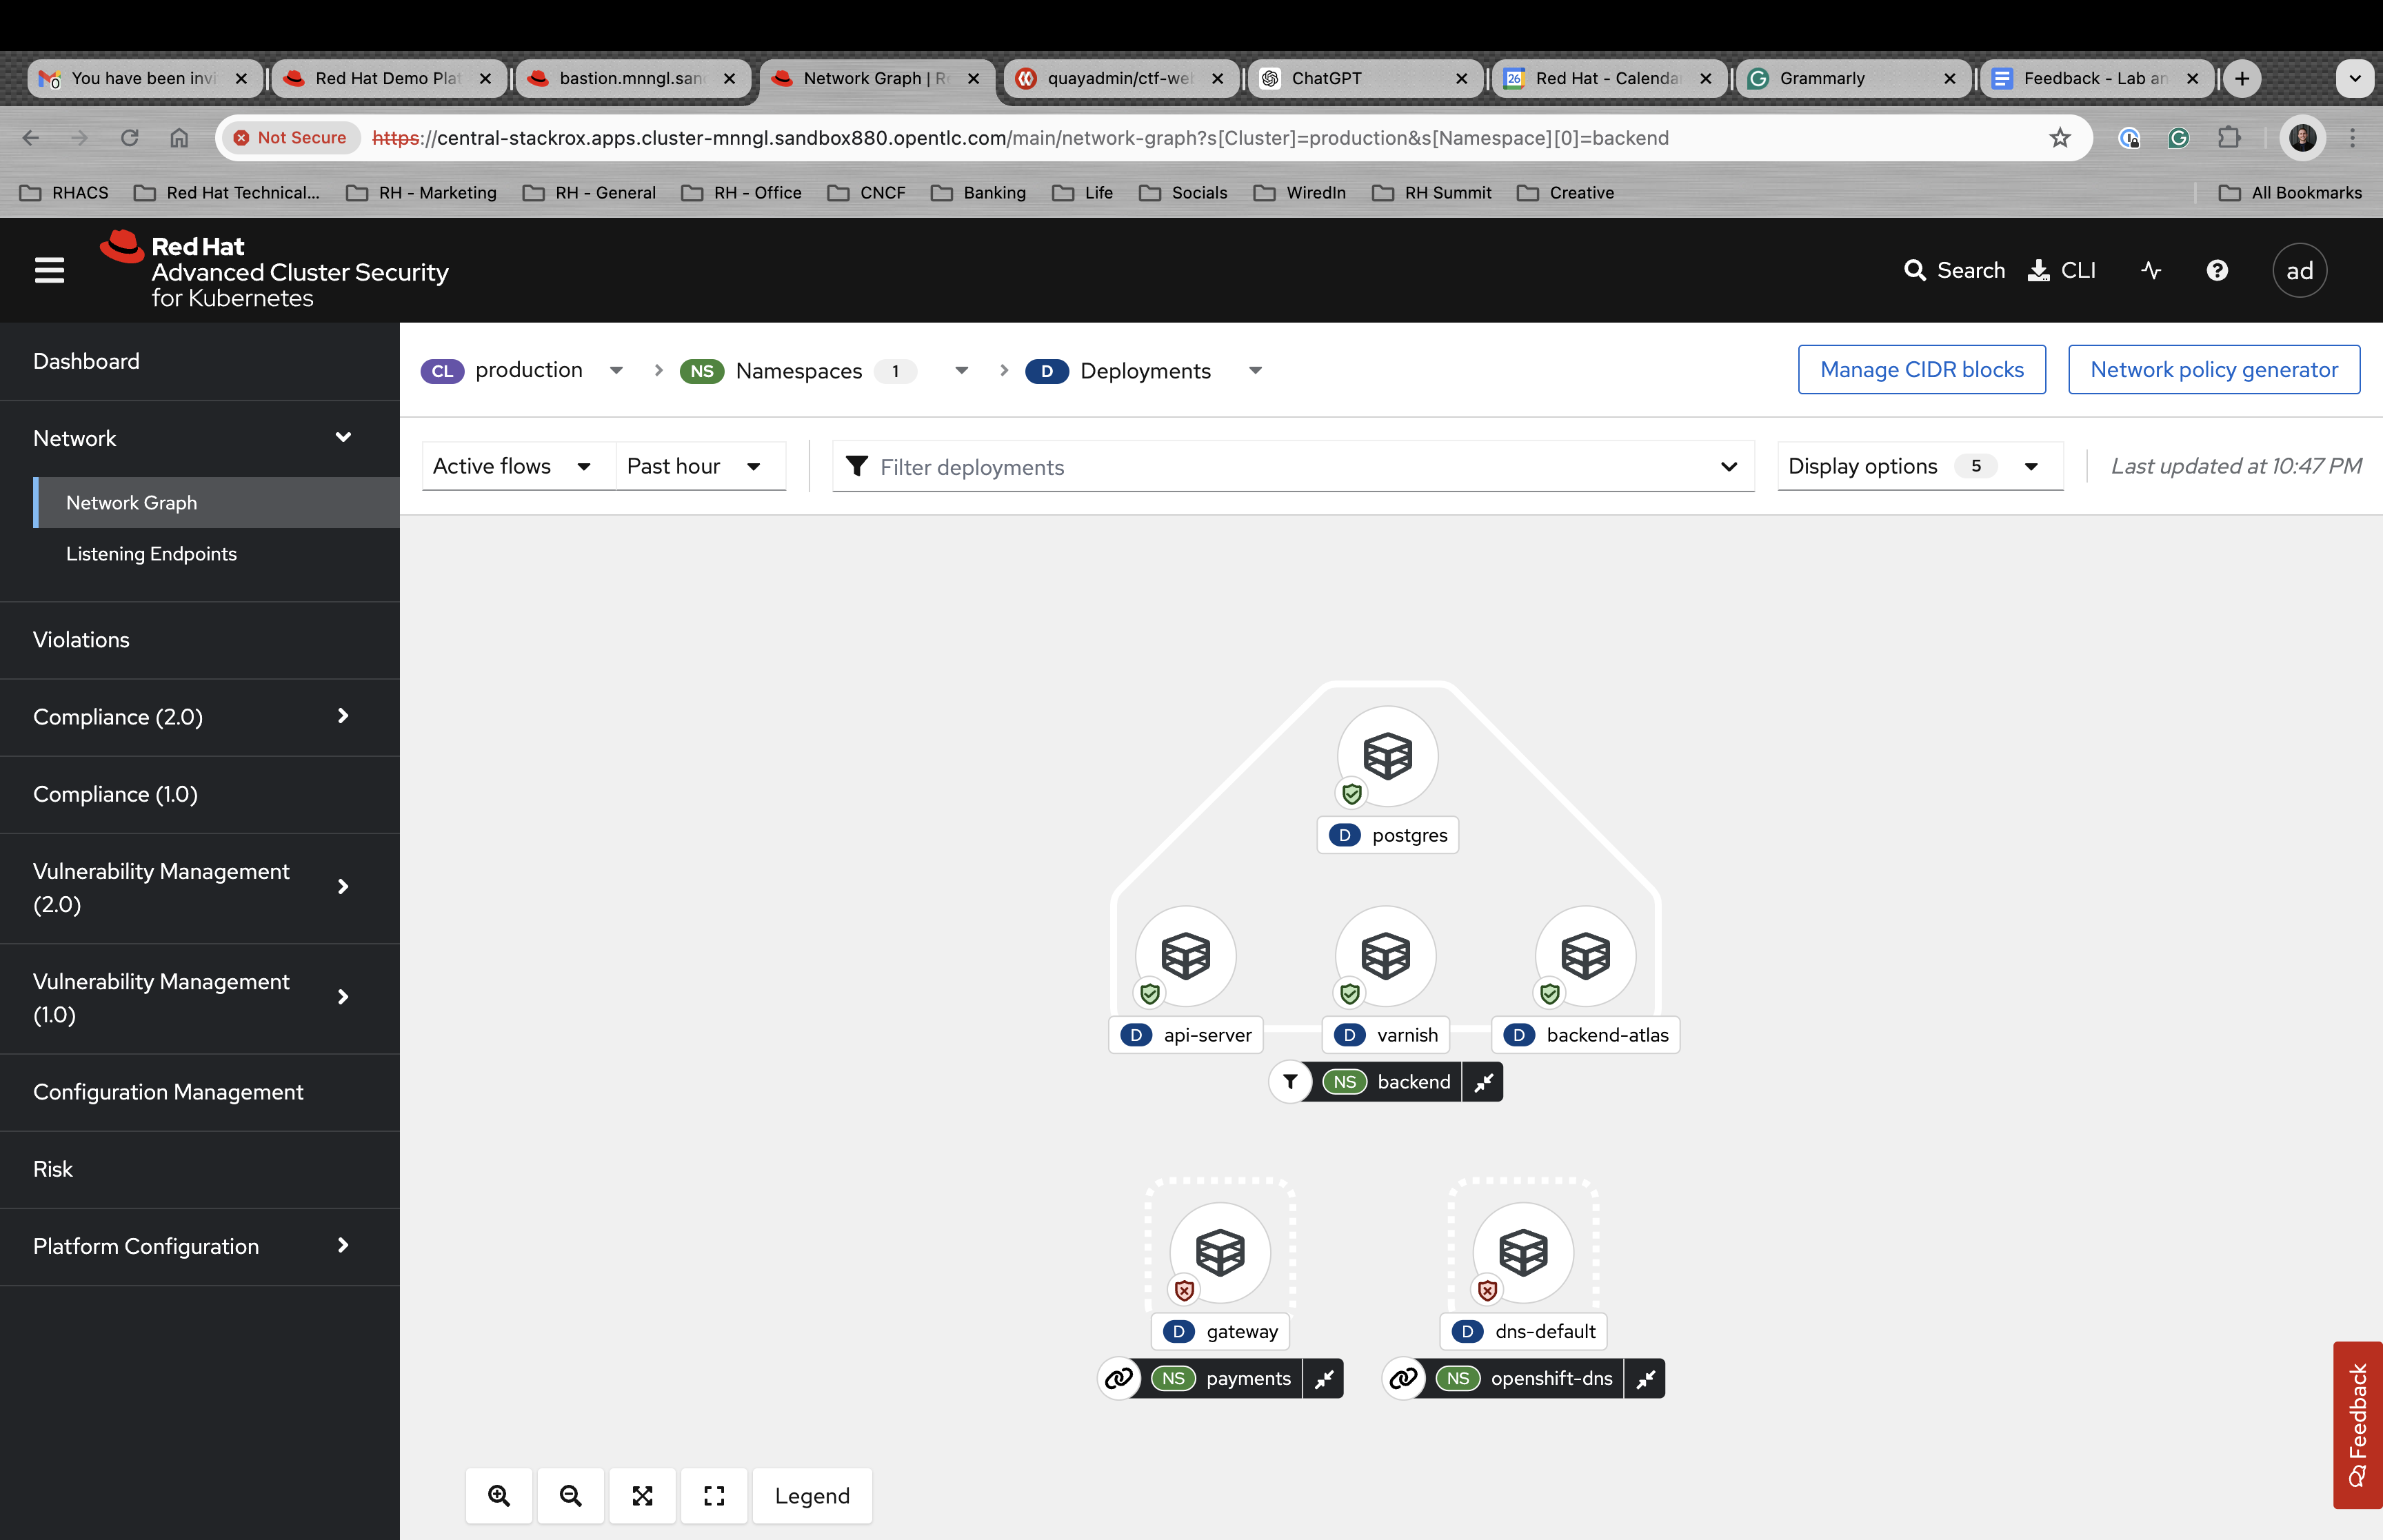
-
Lastly, let’s check the netpol connections output AND our compliance command:
roxctl netpol connectivity map $TUTORIAL_HOME/kubernetes-manifests/medical-application/backend/everything.yml
oc get --all-namespaces networkpolicies -o json | jq '[.items[] | select((.metadata.namespace | startswith("openshift") | not) and (.metadata.namespace | startswith("kube-") | not) and .metadata.namespace != "default") | .metadata.namespace] | unique'
Sample output
INFO:   in file: /home/lab-user/demo-apps/kubernetes-manifests/medical-application/backend/everything.yml, skipping object with type: Secret
...
backend/varnish[Deployment] => backend/api-server[Deployment] : TCP 9001
[lab-user@bastion ~]$ oc get --all-namespaces networkpolicies -o json | jq '[.items[] | select((.metadata.namespace | startswith("openshift") | not) and (.metadata.namespace | startswith("kube-") | not) and .metadata.namespace != "default") | .metadata.namespace] | unique'
[
"backend",
"medical",
"stackrox",
"vault"
]And we see that there is only ONE external connection to the namespace. All other connections are shut down.
Use the 'roxctl netpol generate' command on the rest of the Kubernetes manifests in the $TUTORIAL_HOME/kubernetes-manifests/ folder. Apply these changes and view the updates in the Network Graph UI.
What is the CIS compliance standard percentage now?
6. A Task to Complete on Your Own
LAST ONE
run the following commands to create a publically available applications. You task is to use the network graph and find the external IP address of the redhat.com loadbalancer.
git clone https://github.com/shaneboulden/tailspin-argocd-cd.git netcoreapp
oc new-project tailspin
oc apply -k netcoreapp/overlays/development
sleep 20
while true; do oc exec deploy/leaderboard -n tailspin -c ubi -- curl -s -L https://redhat.com > /dev/null; sleep 3; done

7. Security Exercise: ACME Incident Response
Morgan confirmed unexpected egress from payment-gateway to external IP 185.199.108.153. Sarah must isolate the workload without killing the pod.
You are participating in the ACME Financial Services security incident workshop. Sarah, a senior OpenShift Platform Engineer, and Morgan from Infosec are responding to a breach in the payment-gateway production namespace. An attacker used a compromised CI/CD service account to exec into the payment-gateway pod, deploy a hidden toolkit (/tmp/.hidden_toolkit/exfil.sh), and beacon outbound to a command-and-control server.
Each ACS module ends with a hands-on exercise that advances this incident response story using RHACS and OpenShift platform tools.
7.1. Scenario
Cut the egress now—but don’t restart the pod. We still need the in-memory evidence.
Infosec
7.2. Your task
The steps are there for guidance. If you need help, expand the step and compare your approach to the lab commands.
Step 1 — Switch to your payment gateway namespace
Use your assigned workshop namespace suffix 1.
|
-
Payment gateway (breached workload):
payment-gateway-1 -
Vulnerable Socket.IO demo:
vulnerable-workload-1
Switch to your payment gateway namespace before running commands:
oc project payment-gateway-1If your administrator has not yet provisioned the environment, ask them to run ./setup/deploy-incident-env.sh from the roadshow repository (see setup/README.adoc).
Step 2 — Review external connections in Network Graph
-
In RHACS, open Network Graph.
-
Filter to namespace
payment-gateway-1and deploymentpayment-gateway. -
Click External Entities and confirm connections to the C2 IP address.
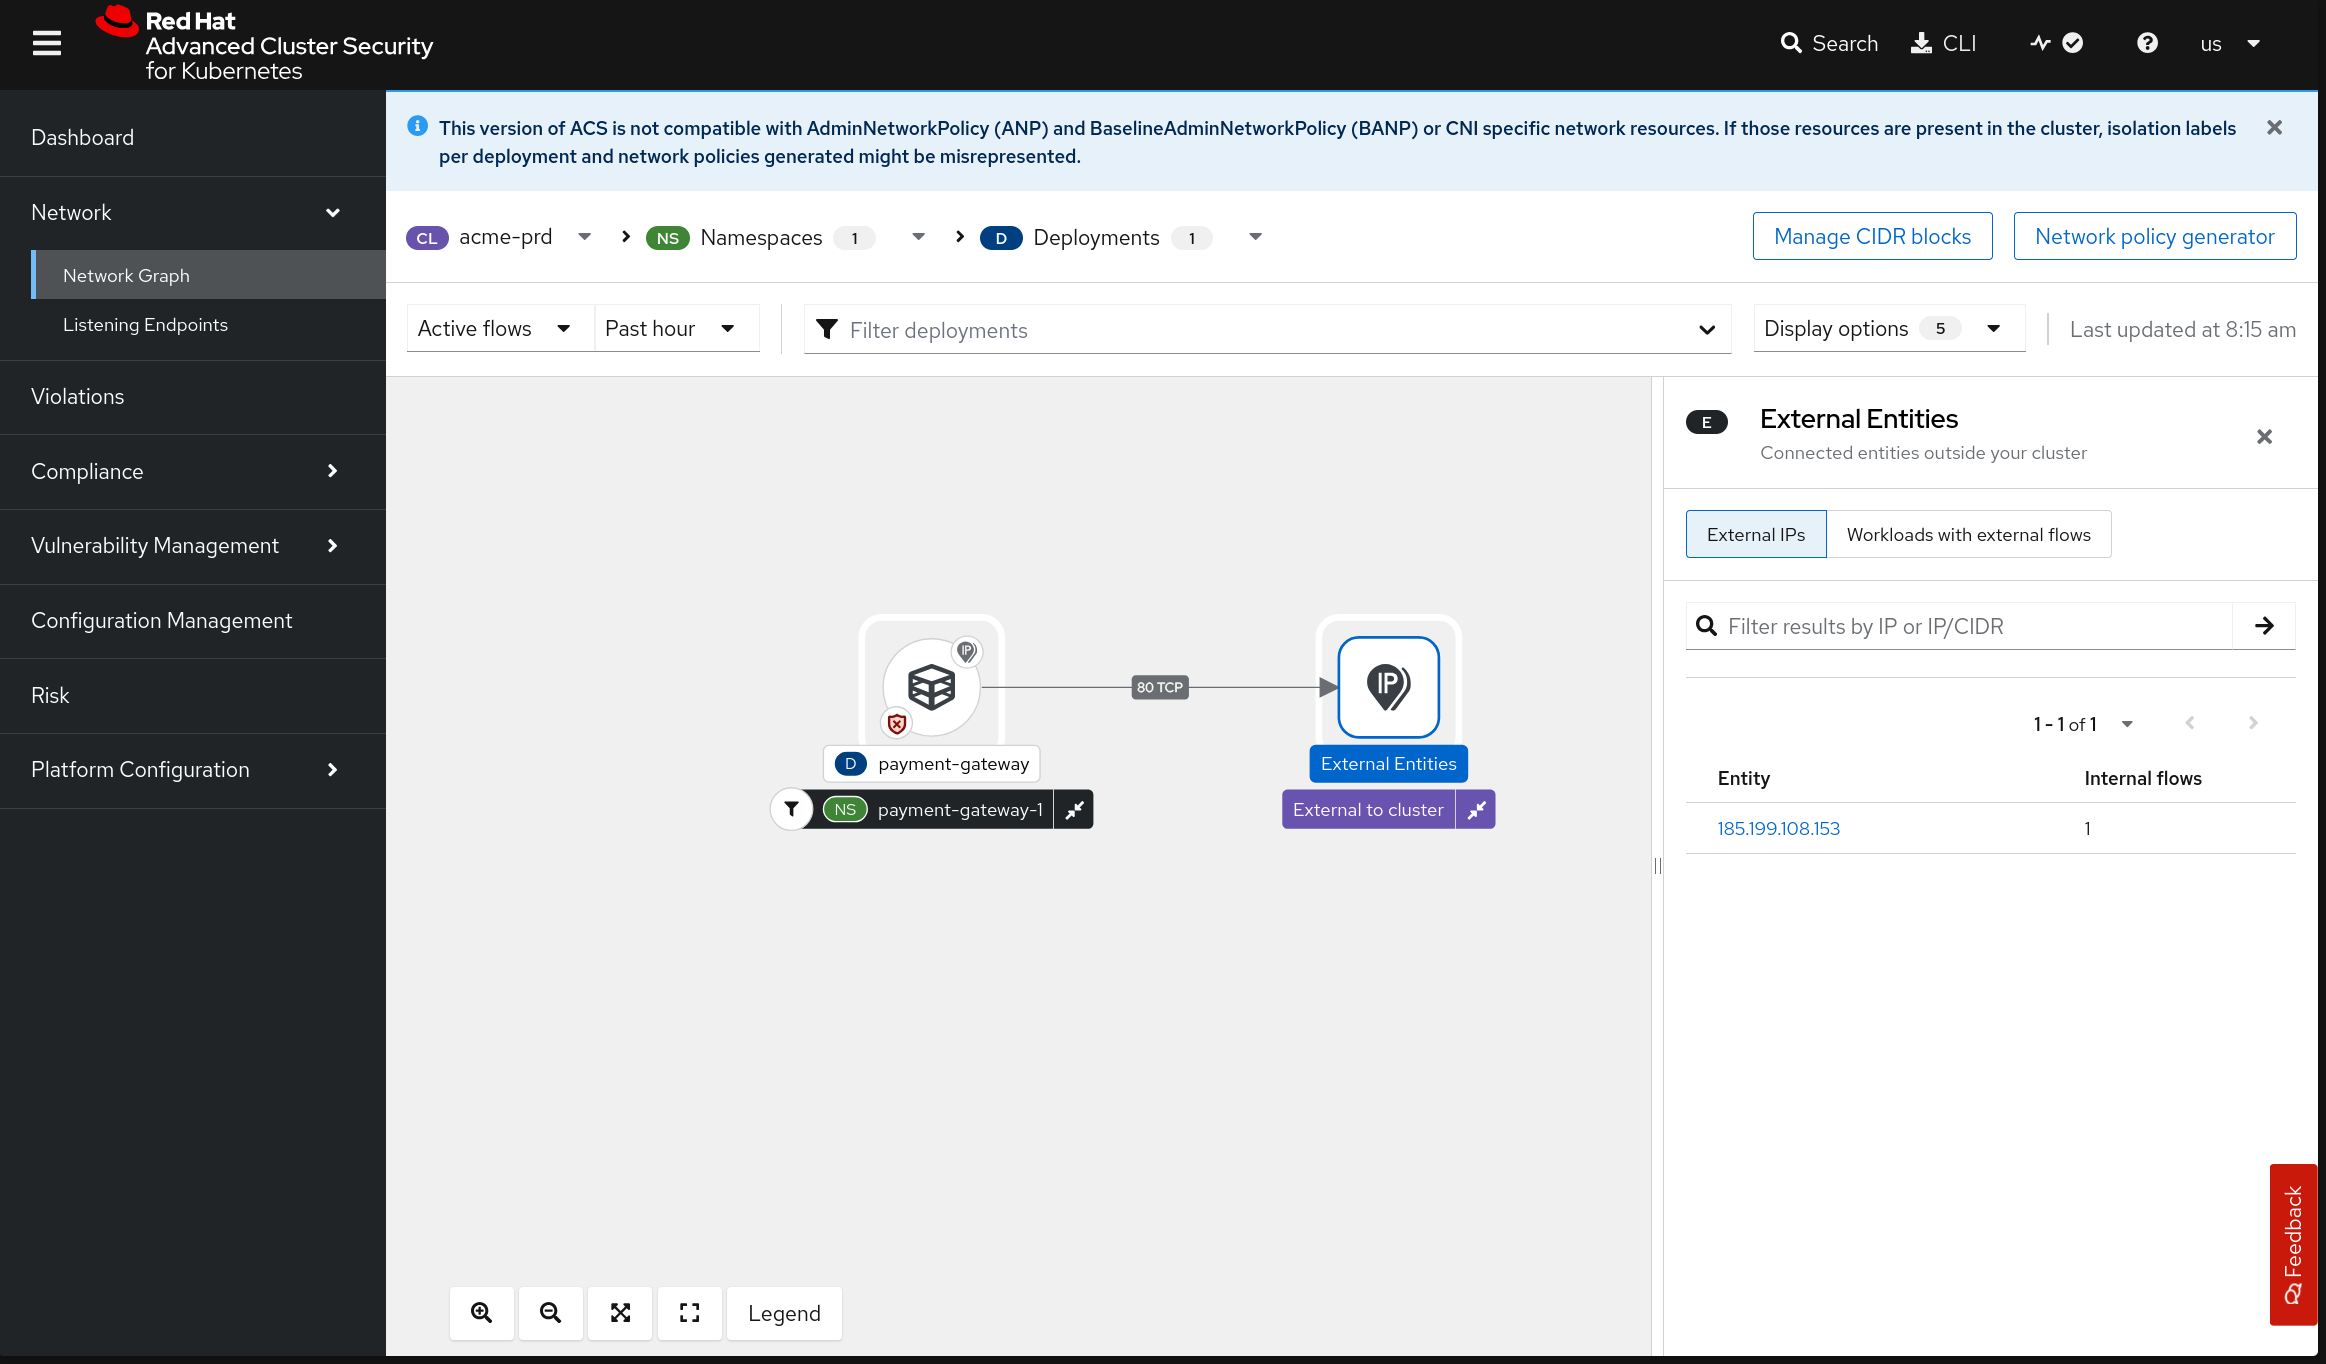
Step 3 — Apply deny-all egress NetworkPolicy
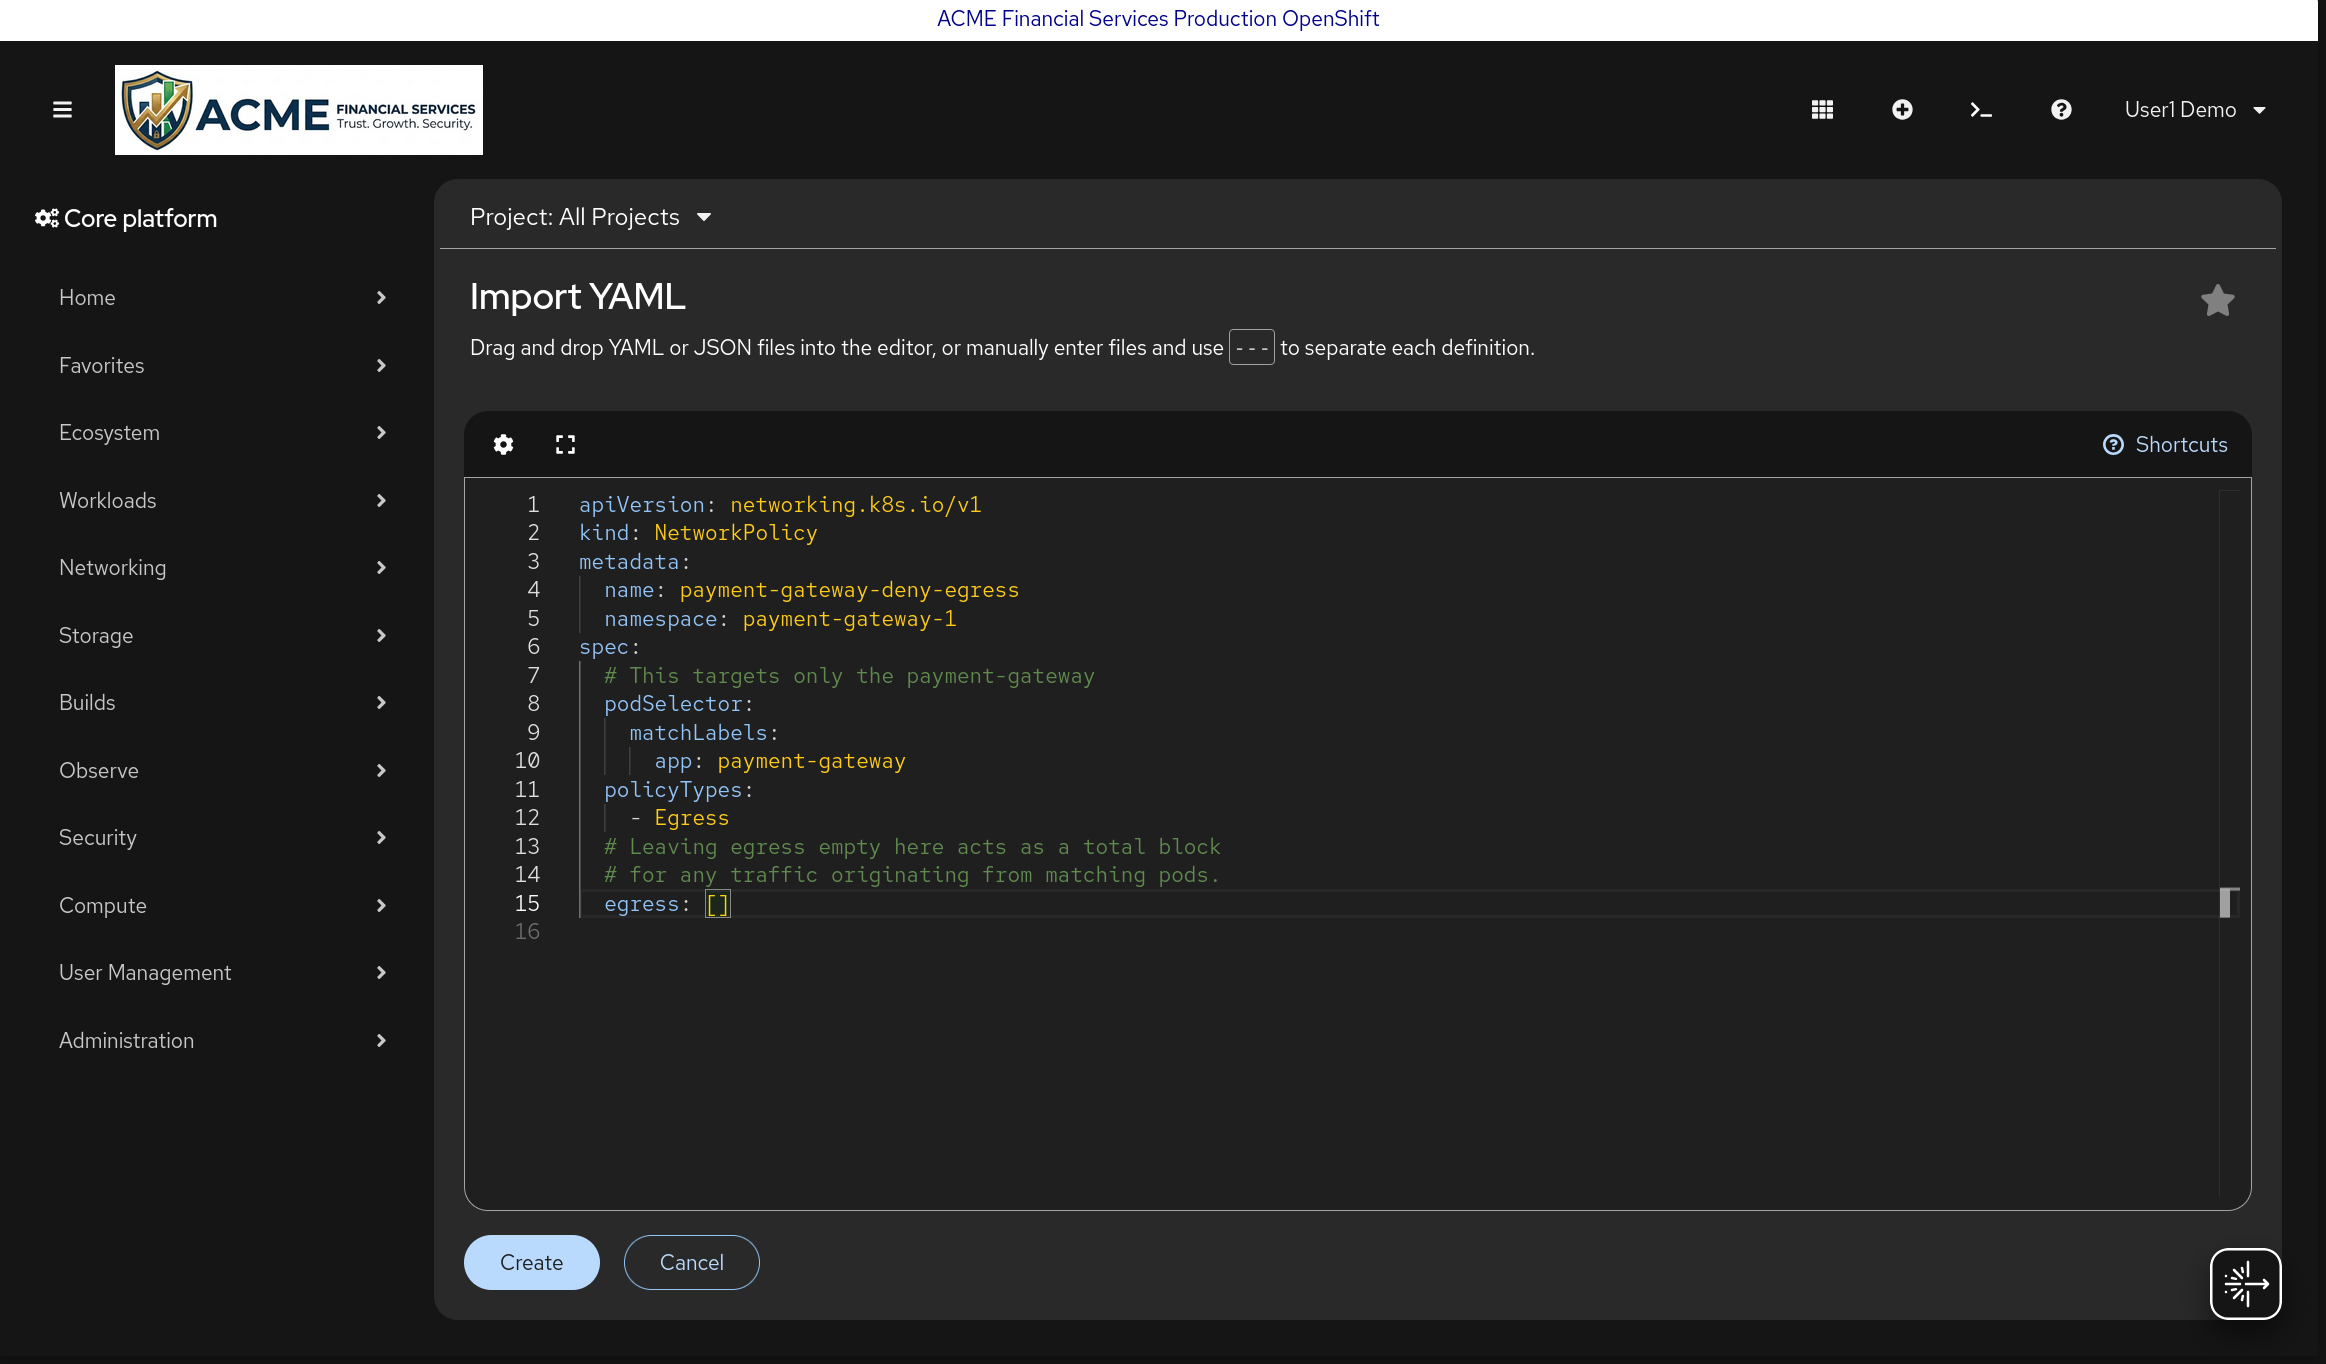
Apply a deny-all egress NetworkPolicy (break-glass during active incident):
apiVersion: networking.k8s.io/v1
kind: NetworkPolicy
metadata:
  name: payment-gateway-deny-egress
  namespace: payment-gateway-{workshop_user_suffix}
spec:
  podSelector:
    matchLabels:
      app: payment-gateway
  policyTypes:
    - Egress
  egress: []
Apply via the OpenShift console Import YAML or:
oc apply -f - <<EOF
apiVersion: networking.k8s.io/v1
kind: NetworkPolicy
metadata:
  name: payment-gateway-deny-egress
  namespace: payment-gateway-1
spec:
  podSelector:
    matchLabels:
      app: payment-gateway
  policyTypes:
    - Egress
  egress: []
EOF
Step 4 — Confirm egress is blocked
Return to the Network Graph and confirm egress traffic is blocked while the pod keeps running.
8. Summary
In this module, you enforced a runtime policy, worked the Network Graph, and used roxctl netpol generate to apply network policies.
Next: Installation.